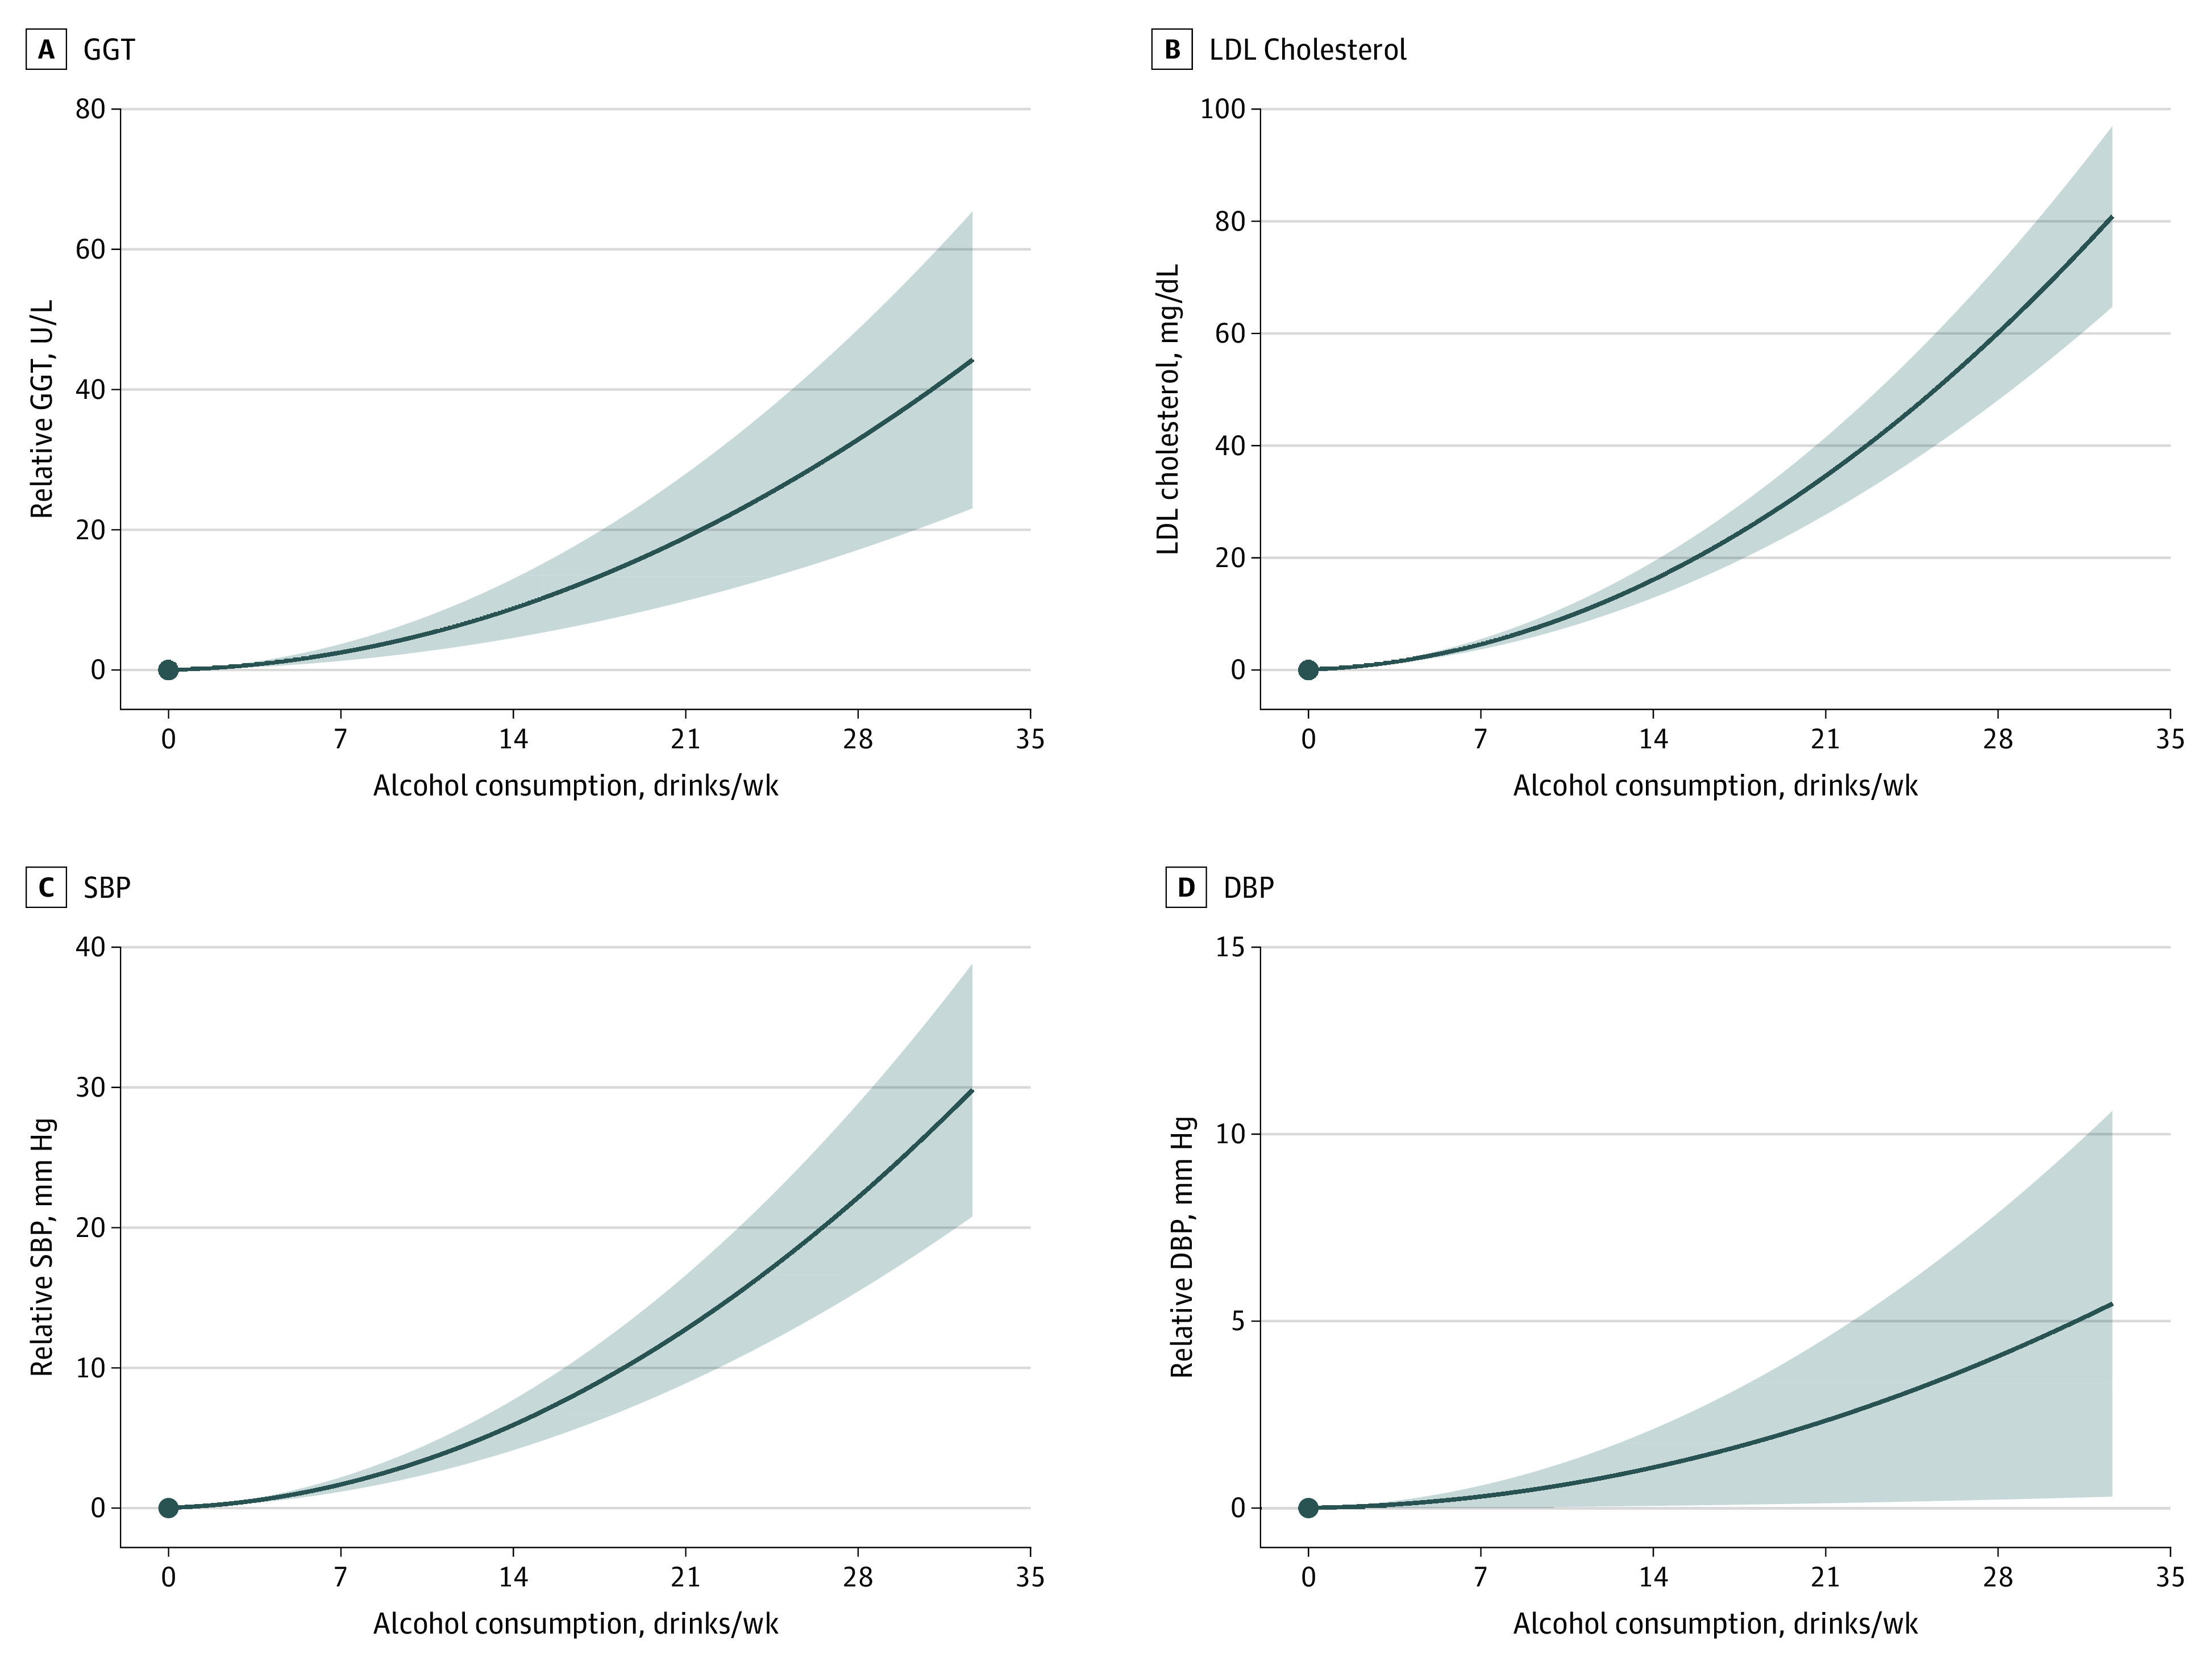
Figure 3. Genetic Associations of Alcohol Consumption With Continuous Traits and Cardiovascular Risk Factors.

Using fractional polynomial nonlinear mendelian randomization analyses with Alcohol Use Disorder–Restricted instruments, localized average causal effects were metaregressed against mean consumption in each strata of alcohol, and these plots were reconstructed as the derivative of the best fit model for γ-glutamyl transferase (GGT), low-density lipoprotein (LDL) cholesterol, systolic blood pressure (SBP), and diastolic blood pressure (DBP). Alcohol consumption is reported as US standard drinks per week, with each standard drink equivalent to 14 g of alcohol. Solid lines refer to odds ratio (OR) estimates, and shaded areas denote 95% CIs for the model.
