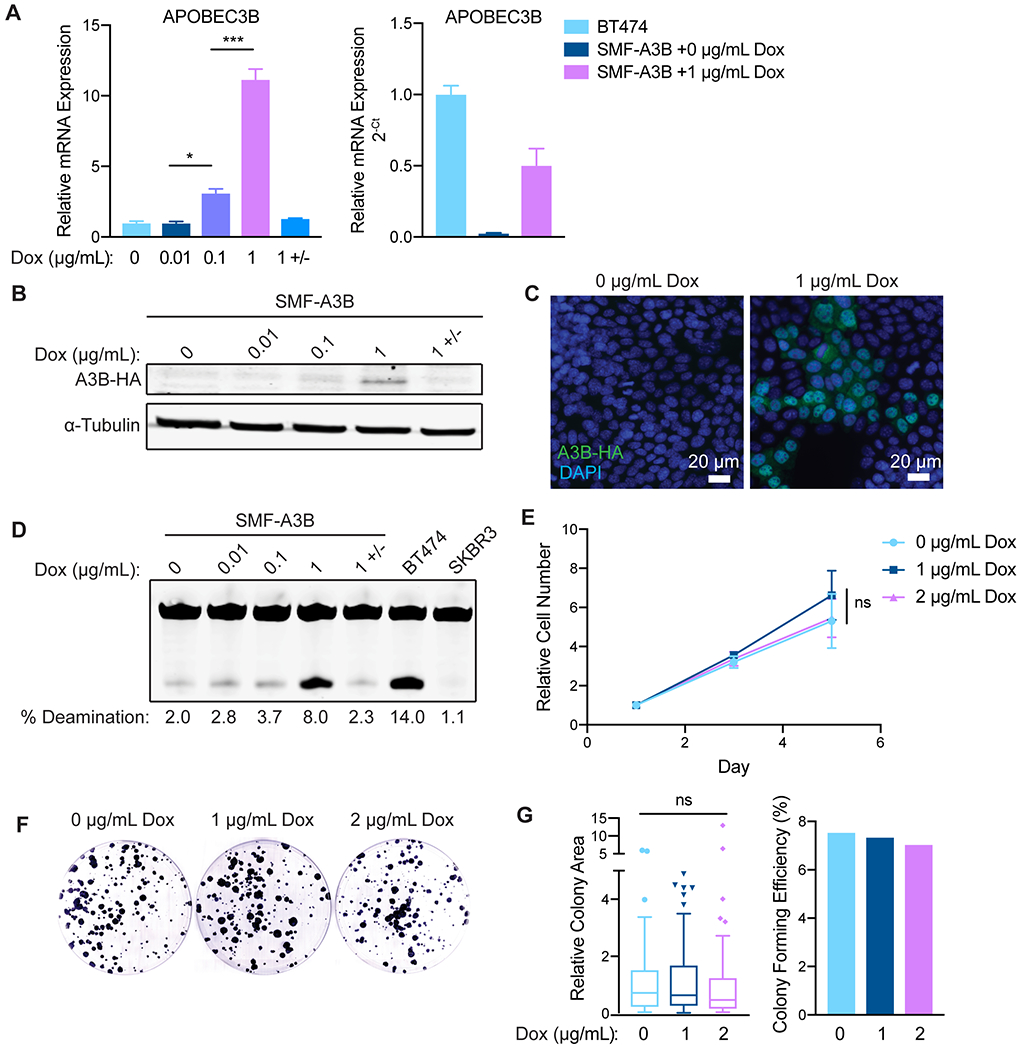
Figure 1: SMF-A3B cells express titratable and reversible APOBEC3B without loss of cell viability.

(A) qRT-PCR of A3B gene expression in SMF-A3B cells treated with the indicated concentrations of dox for 2 days. 1 +/− indicates treatment with 1 μg/mL of dox for 2 days, then removal of dox for 2 days. Left: A3B expression relative to 0 μg/mL dox. Right: A3B expression relative to BT474 cells. Data are representative of 2 independent experiments. Results are shown as mean±SD of 3 biological replicates. Significance was determined using a one-way ANOVA and Tukey’s multiple comparisons test. (B) Western blot of HA-tagged A3B in SMF-A3B cells treated with dox as in (A). (C) Immunofluorescence for the HA epitope in SMF-A3B cells treated with dox as in (A), showing nuclear localization of HA-A3B. Blue: DAPI; green: HA. (D) In vitro cytidine deaminase activity assay of SMF-A3B cells treated with dox as in (A). The APOBEC-high human cell line BT474 and the A3B-null human cell line SKBR3 were controls. (E) CellTiter-Glo assay showing growth curves of SMF-A3B cells treated with the indicated concentration of dox. Results are shown as mean±SD of 3 replicates. Statistical significance was determined by two-way ANOVA. (F) Clonogenic assay of SMF-A3B cells cultured with dox for 2 weeks to measure long term survival. Colonies were stained with crystal violet. (G) Quantification of clonogenic assay in (F). Left: Boxplots (Tukey method) depicting the relative colony area. Line shows median value, box shows 25th and 75th percentiles, and whiskers show 1.5-times the interquartile range (IQR); points outside 1.5-times IQR are plotted individually. Statistical significance was determined using a one-way ANOVA. Right: Colony forming efficiency in each condition. ns: not significant, p > 0.05; *p<0.05, **p<0.01, ***p<0.001.
