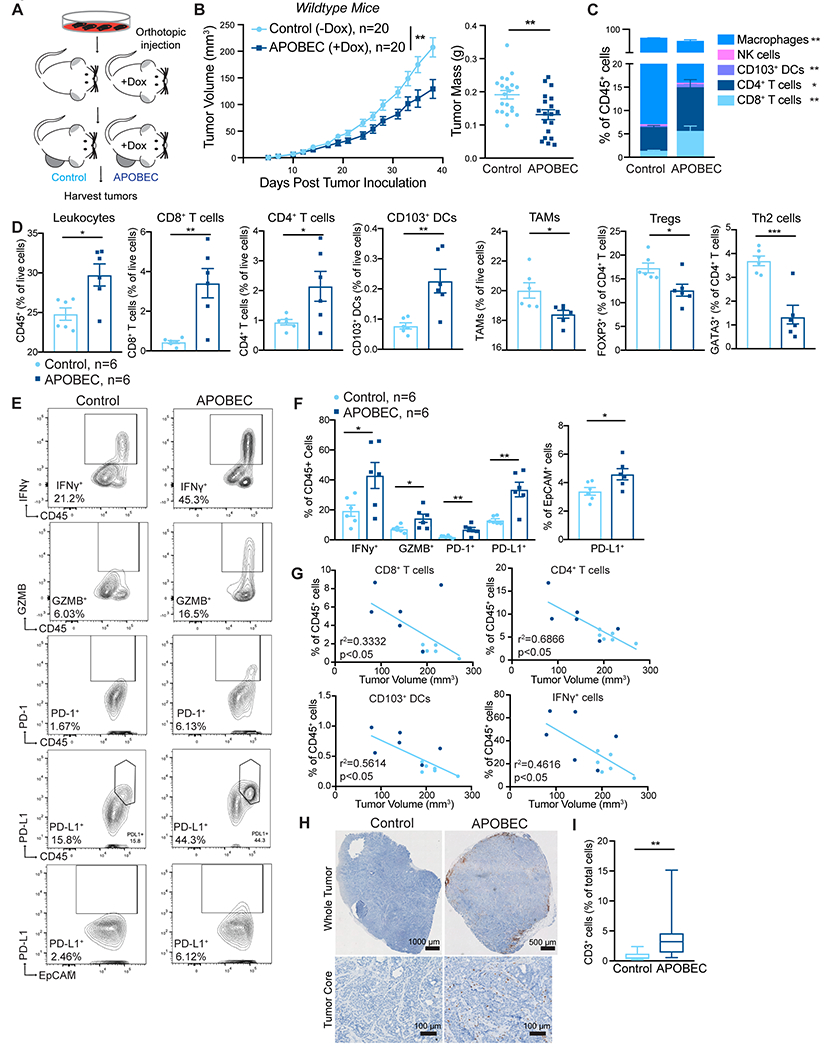
Figure 2: A3B expression slows tumor growth and triggers the infiltration of antitumor immune cells into the tumor core.

(A) Schematic showing experimental design for tumor growth experiment. SMF-A3B cells were orthotopically implanted in the mammary gland of mice. The APOBEC cohort was administered dox in the drinking water and control cohort was administered normal drinking water until endpoint. (B) Left: tumor volume of control (n=20) and APOBEC tumors (n=20) in wildtype mice. Statistical significance was determined by two-way repeated-measures ANOVA. Right: tumor mass (grams, g) of control and APOBEC tumors at endpoint. Statistical significance was determined by unpaired Student’s t-test. Error bars denote mean±SEM. Data are representative of 2 independent experiments. (C) The frequency of immune cell types, expressed as a percentage of total CD45+ cells, in control (n=6) and APOBEC (n=6) tumors determined by flow cytometry. (D) Flow cytometry quantification of immune cells in control (n=6) and APOBEC (n=6) tumors. Leukocytes, CD8+ T cells, CD4+ T cells, CD103+ DCs, and TAMs are represented as the percentage of total live cells. Tregs and Th2 cells are represented as the percentage of total CD4+ T cells. Statistical significance was determined by unpaired Student’s t-test. Error bars denote mean±SEM. (E-F) Representative flow cytometry plots (E) and quantification (F) for IFNγ, granzyme B, PD-1, and PD-L1 in control (n=6) and APOBEC (n=6) tumors. Statistical significance was determined by unpaired Student’s t-test. Error bars denote mean±SEM. (G) Pearson correlation between immune cell frequency and mean tumor volume (mm3) in control (light blue) and APOBEC (dark blue) tumors. Only significant correlations are shown, R-squared values are indicated. Results in A-G are representative of two independent experiments. (H) IHC CD3 (T cells) in control and APOBEC tumors. Top: tiled scan of the whole tumor. Bottom: representative region in the tumor core. scale bar: 1000 μm (Control), 500 μm (APOBEC) (I) Quantification of CD3 for control (n=4) and APOBEC (n=4) tumors. Four fields-of-view were imaged for each tumor. Boxplots: median percentage of CD3+ cells with minimum and maximum whiskers. Statistical significance was determined by unpaired Student’s t test with Welch’s correction. *p<0.05, **p<0.01, ***p<0.001
