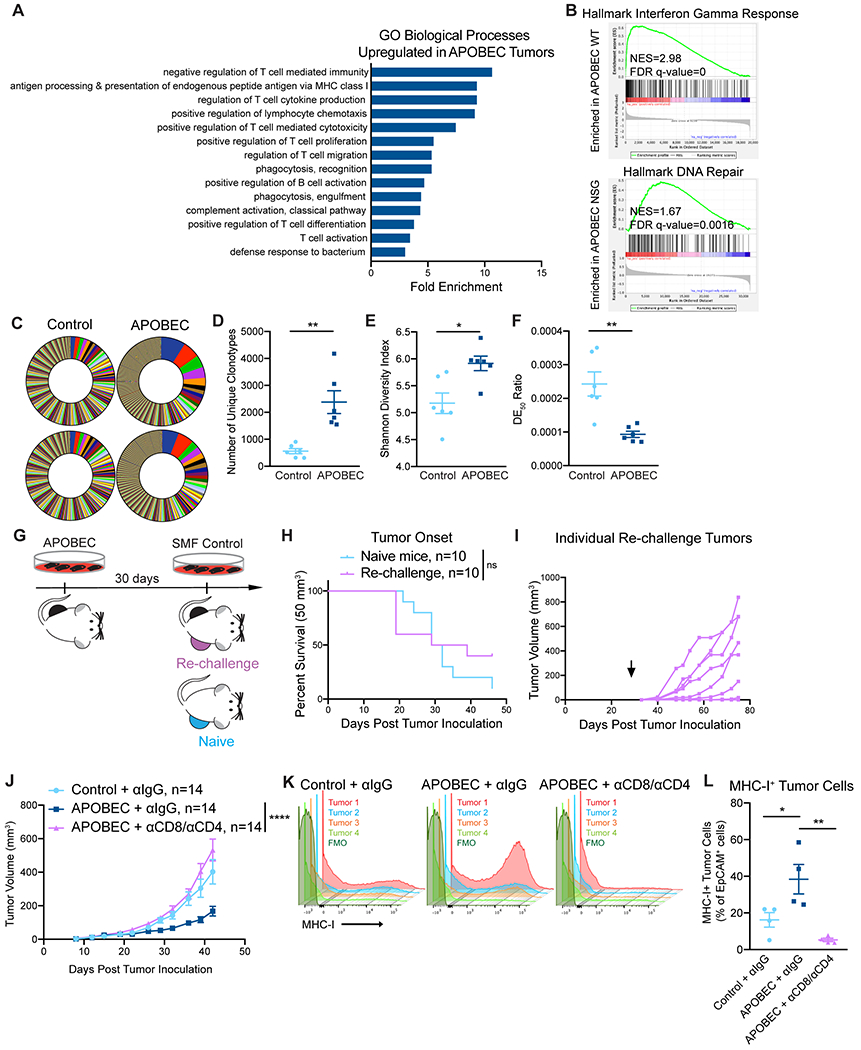
Figure 3: T cell-dependent antitumor responses in APOBEC tumors are antigen-specific.

(A) Gene ontology (GO) analysis of differentially expressed genes between control and APOBEC tumors in immunocompetent mice. Fold enrichment of select GO biological processes that were significantly enriched in APOBEC tumors (n=6) compared to control tumors (n=6) are shown; FDR<0.05, Fisher’s test. Also see Supplementary Fig. S6A. (B) GSEA between control and APOBEC tumors. Representative gene sets enriched in APOBEC tumors in immunocompetent mice (top) or immunodeficient mice (bottom) are shown. Normalized Enrichment Scores (NES) and FDR q-values are shown. Also see Supplementary Fig. S6B–C. (C) TCR-sequencing from control (n=6) and APOBEC tumors (n=6) from wildtype mice. Pie charts: unique TCR clonotypes ranked by abundance in two control and two APOBEC tumors. (D) Quantification of the total number of unique clonotypes in control and APOBEC tumors (n=6/cohort). (E) Shannon diversity index of the TCR repertoire in control and APOBEC tumors. (F) TCR DE50 ratios in control and APOBEC tumors. Error bars in (D-F) denote mean±SEM. Statistical significance was determined by unpaired Student’s t test in (E) and unpaired Student’s t test with Welch’s correction in (D, F). (G) Schematic showing experimental design of tumor re-challenge. Clonal APOBEC-mutagenized cells were implanted unilaterally in the mammary fat pad. 30 days later, SMF control cells were implanted in the contralateral mammary fat pad (Re-challenge, n=10). Re-challenge tumors were compared to control cells implanted in naïve mice (Naïve, n=10). (H) Kaplan-Meier curves showing tumor onset (50 mm3) for re-challenge mice and naïve mice from (G). Statistical significance was determined by log-rank test. (I) Tumor growth curves of individual re-challenge tumors from (G). Arrow indicates day of re-challenge. (J) Tumor volume (mm3) over time for control tumors treated with isotype control antibody (n=14) and APOBEC tumors treated with isotype control (n=14) or CD8 and CD4 depletion antibodies (n=14) in wildtype mice. Error bars denote mean±SEM. Statistical significance was determined by two-way repeated-measures ANOVA and Tukey’s multiple comparisons test. (K) Flow cytometry histograms showing MHC-I expression on EpCAM+ tumor cells from tumors in (J). (L) Quantification of MHC-I+ cells, expressed as a percentage of EpCAM+ cells, in tumors (n=4 per cohort) from (J). Results in K and L are from a single experiment. Error bars denote mean±SEM. Statistical significance was determined by one-way ANOVA and Tukey’s multiple comparisons test. ns: not significant, p>0.05; *p<0.05, **p<0.01, ****p<0.0001
