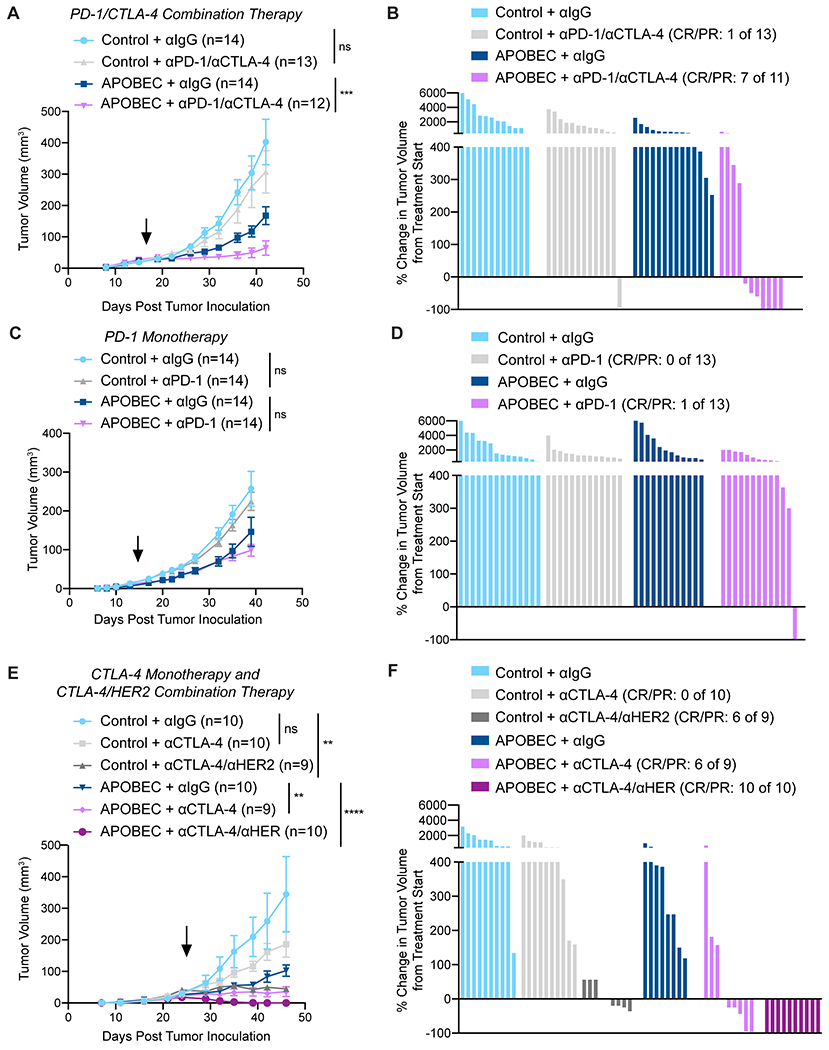
Figure 4: APOBEC tumors are sensitive to combination anti-PD-1/anti-CTLA4 immune checkpoint blockade.

(A) Tumor volume (mm3) over time for control and APOBEC tumors treated with isotype control or anti-PD-1/anti-CTLA-4. Arrow: treatment start. Error bars denote mean±SEM. Statistical significance was determined by two-way repeated-measures ANOVA and Tukey’s multiple comparisons test. (B) Percent-change in tumor volume from treatment start for palpable tumors from (A) until endpoint. Bars denote individual tumors. (C) Tumor volume (mm3) over time for control and APOBEC tumors treated with isotype control or anti-PD-1 monotherapy. Arrow: treatment start. Error bars denote mean±SEM. Statistical significance was determined by two-way repeated-measures ANOVA and Tukey’s multiple comparisons test. (D) Percent-change in tumor volume from treatment start for palpable tumors from (C) until endpoint. Bars denote individual tumors. (E) Tumor volume (mm3) over time for control and APOBEC tumors treated with isotype control, anti-CTLA-4 monotherapy, or anti-CTLA-4/anti-HER2. Arrow: treatment start. Error bars denote mean±SEM. Statistical significance was determined by two-way repeated-measures ANOVA and Tukey’s multiple comparisons test. (F) Percent-change in tumor volume from treatment start for palpable tumors from (E) until endpoint. Bars denote individual tumors. CR, complete response; PR, partial response. ns: not significant, p>0.05; **p<0.01, ***p<0.001, ****p<0.0001
