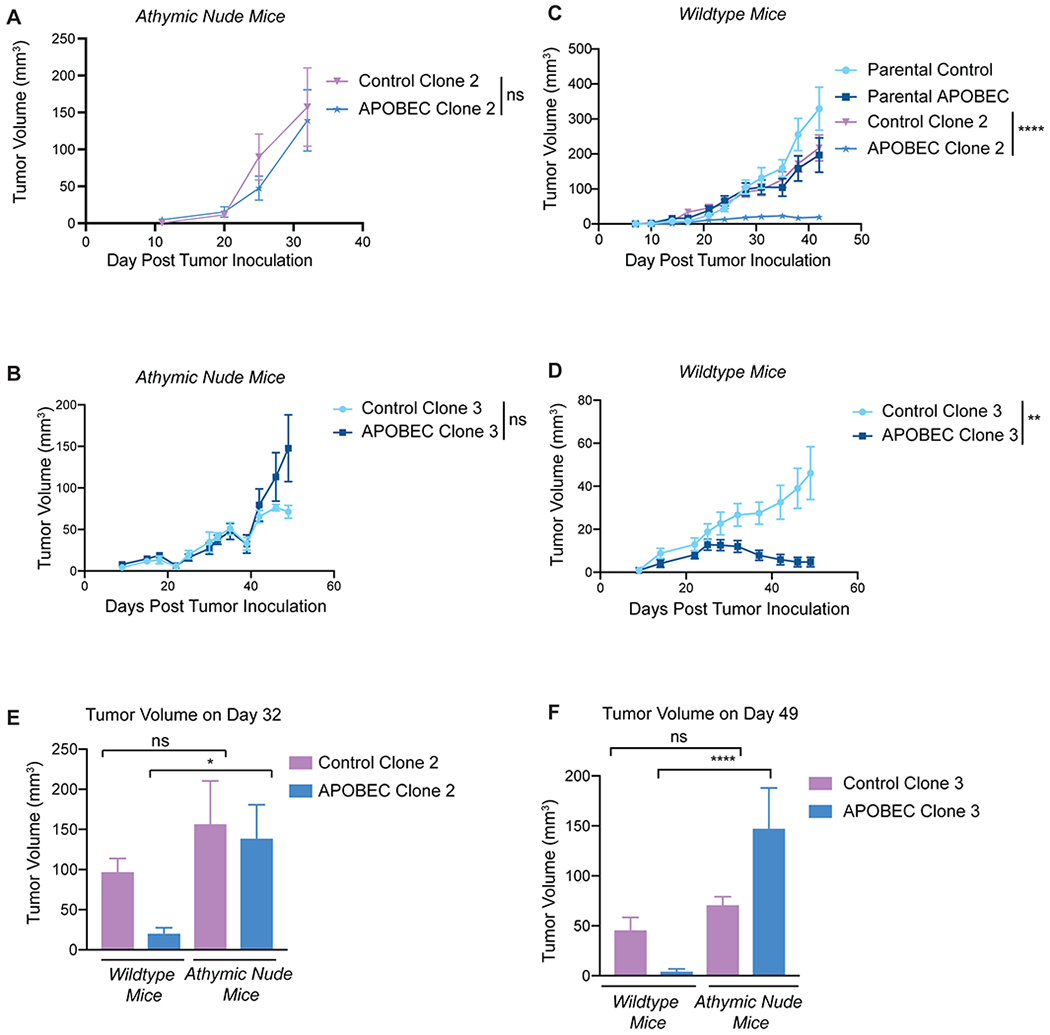
Figure 5: Complete immune-mediated suppression of clonal APOBEC tumor growth.

(A) Tumor volume (mm3) over time for control clone 2 and APOBEC clone 2 injected in the mammary gland of athymic nude mice. N= 4 mice per clone. (B) Tumor volume (mm3) over time for control clone 3 and APOBEC clone 3 injected in the mammary gland of athymic nude mice. N=6 mice per clone. (C) Tumor volume (mm3) over time for control and APOBEC clones, as well as the corresponding polyclonal parental populations, injected in the mammary gland of immunocompetent wildtype mice. N=14 mice per cell line. (D) Tumor volume (mm3) over time for control clone 3 and APOBEC clone 3 injected in the mammary gland of wildtype mice. N=10 mice per clone. For (A-D), statistical significance was determined by two-way repeated-measures ANOVA; error bars denote mean±SEM. (E) Comparison of tumor volume on day 32 between control clone 2 and APOBEC clone 2 grown in immunocompromised nude mice from (A) and immunocompetent wildtype mice from (C). (F) Comparison of tumor volume on day 49 between control clone 3 and APOBEC clone 3 grown in immunocompromised nude mice from (B) or immunocompetent wildtype mice from (D). For (E-F), statistical significance was determined by one-way ANOVA and Sidak’s multiple comparisons test; error bars denote mean±SEM; ns: not significant, p>0.05; *p<0.05, ****p<0.0001.
