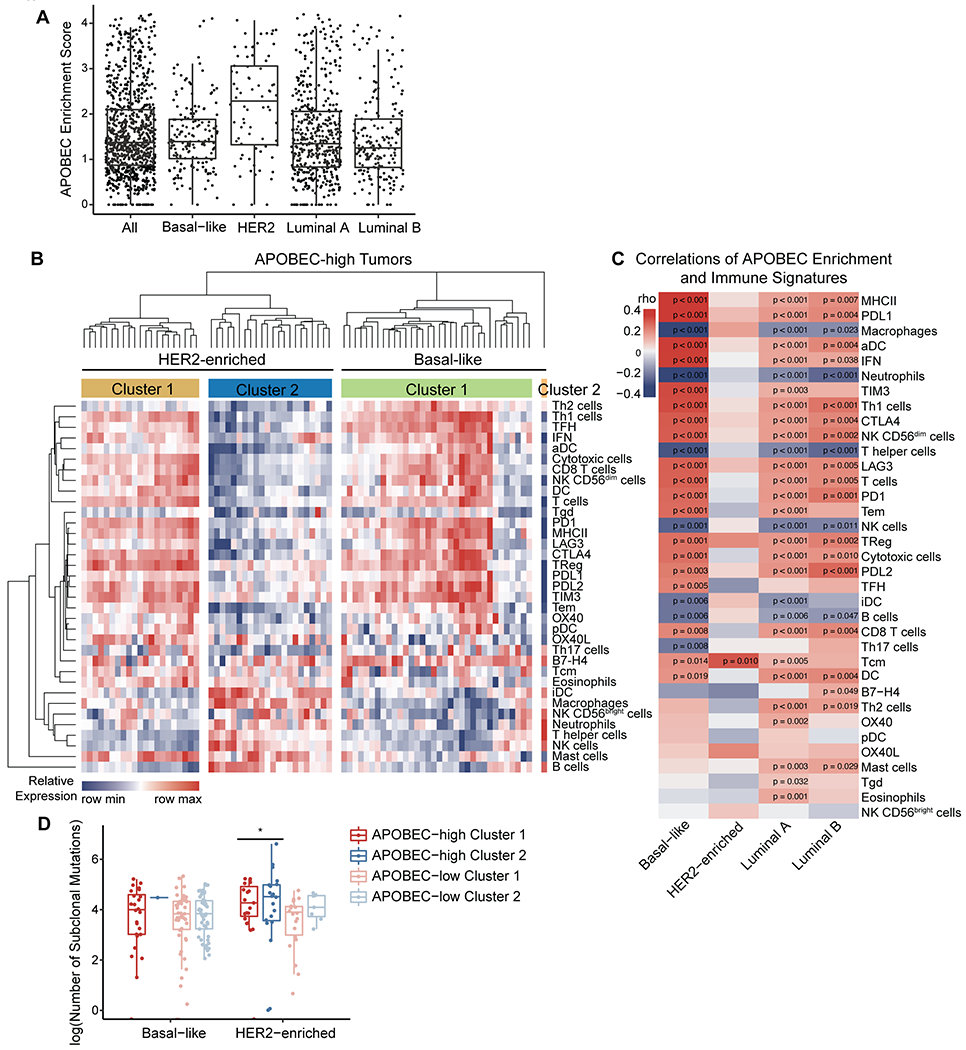
Figure 6: The TME phenotype of APOBEC-high human breast cancers is dependent on molecular subtype and the number of subclonal mutations.

(A) APOBEC enrichment score calculated from WES data for all TCGA breast cancer samples. APOBEC enrichment score of 2 or higher delineates APOBEC-high tumors. Boxplots: Line shows median value, box shows 25th and 75th percentiles, and whiskers show 1.5-times the IQR. (B) Heatmap showing the relative expression of immune cell gene signatures from TCGA RNA-seq data in APOBEC-high tumors, grouped by breast cancer subtype. (C) Heatmap showing correlation Spearman’s rho values between APOBEC enrichment score and immune gene signatures for each molecular subtype of breast cancer. Red, immune signature positively correlated with APOBEC enrichment score; blue, immune signature negatively correlated with APOBEC enrichment score. (D) The number of subclonal mutations (from (44)) in APOBEC-high clusters depicted in (B) and APOBEC-low clusters depicted in Supplementary Figure S9. Boxplots: Line shows median value, box shows 25th and 75th percentiles, and whiskers show 1.5-times the IQR. Statistical significance was determined one-way ANOVA and Sidak’s multiple comparisons test. *p<0.05.
