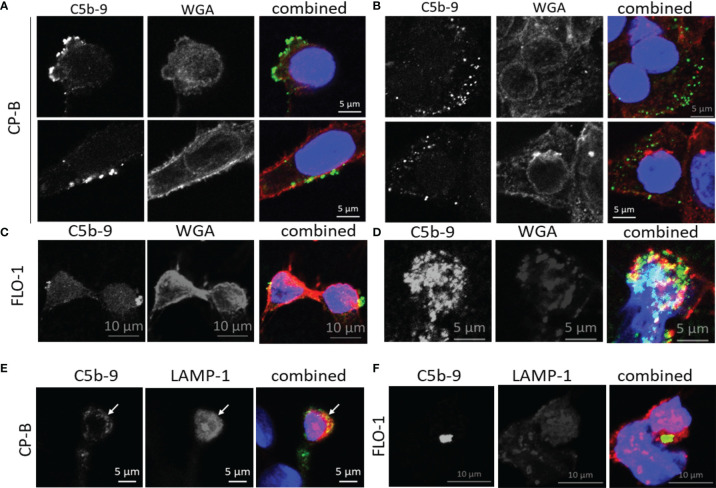
Figure 5.
Subcellular localization of C5b-9 in Barrett’s esophagus and esophageal adenocarcinoma cell lines after exposure to purified C9 in culture. After 75 minutes of C9 exposure of CP-B (A, B) or FLO-1 (C, D) cells as described for Figure 3 , co-staining of C5b-9 (green) was conducted with wheat germ agglutinin (WGA, red) to visualize the plasma membrane. The nucleus was stained with DAPI (blue). C5b-9 was observed at the cell surface (A, C), as well as intracellularly (B, D). These images represent one slice of Z-stack images acquired by confocal microscopy, adjoining Z-stack images are shown in Figure S4 . A separate experiment with 120 minutes of C9 exposure was used for co-staining with the lysosome marker LAMP-1 (red) in CP-B (E) and FLO-1 (F). Yellow color in the combined images indicates colocalization between the red and green signals.

