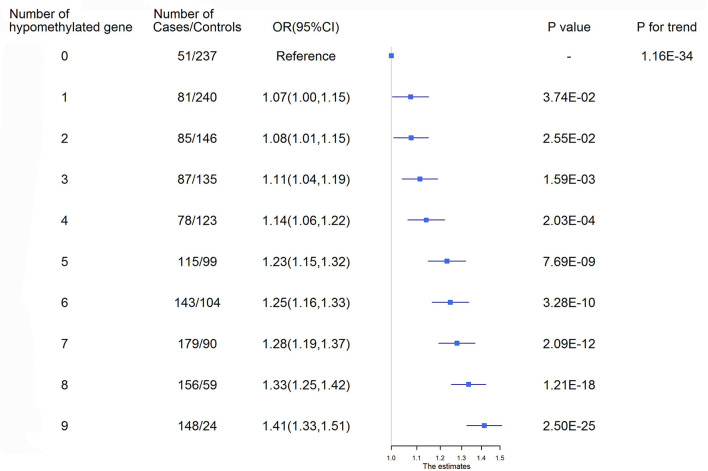
Figure 2.
Ischemic stroke risk according to the number of hypomethylated genes. ROC curves were used to obtain the optimal cutoff points for the representative targets of 9 genes, including AMH_3 (<3.21%), C17orf82_3 (<3.35%), HDAC9_1 (<1.88%), IGFBP3_2 (<3.90%), LRRC10B_1 (<1.09%), PDE3A_3 (<2.47%), PRDM6_3 (<2.01%), SYT7_1 (<1.98%) and TBX2_3 (<3.00%), to define hypomethylation. CI, Confidence interval; OR, Odds ratio.

