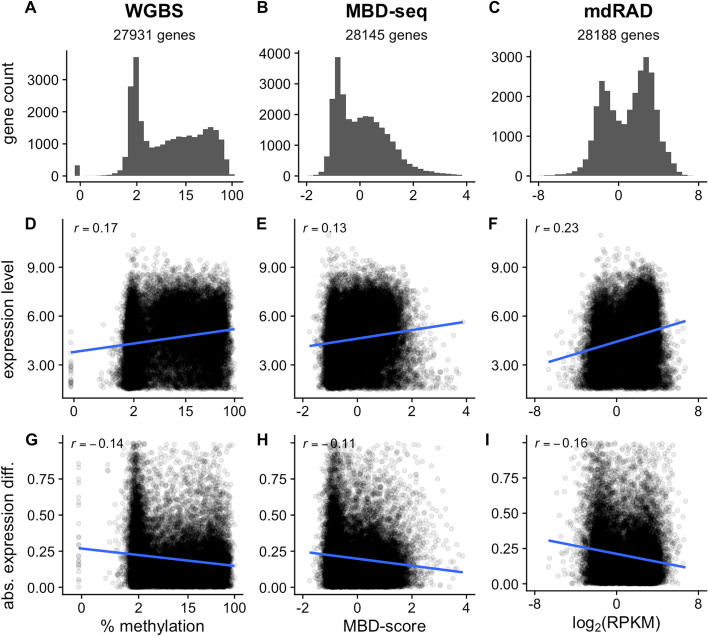
Fig. 2.
Associations between GBM level and gene expression patterns in A. millepora based on three different methylation assays. A-C Distribution of GBM levels D-F Relationship between GBM level and mRNA abundance G-I Relationship between GBM level and the absolute value of differential mRNA expression between axial and radial polyps. X-axes for the assays are as follows. Whole Genome Bisulfite Sequencing (WGBS): percent methylation (summed across all CpG sites of each gene and averaged across all samples) on the log2 scale; Methylation Binding Domain Sequencing (MBD-seq): the log2 difference in fold coverage between the captured and unbound fractions (MBD-score, see methods); methylation dependent RAD-seq (mdRAD): Reads per Kilobase of gene sequence per Million reads on the log2 scale (log2(RPKM)). The correlation coefficient is given in the upper left hand of each plot

