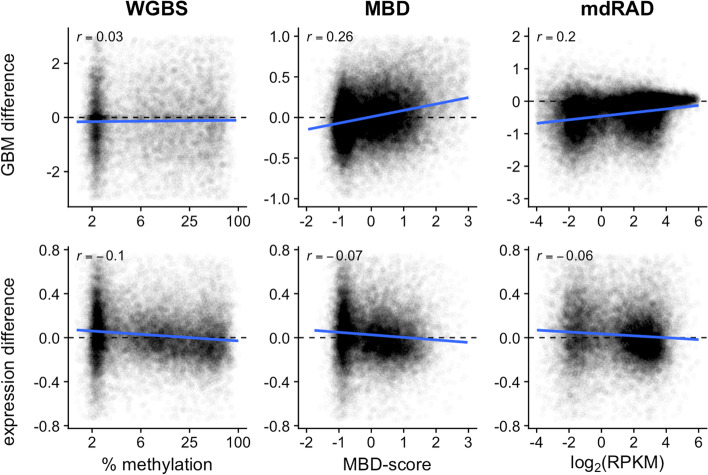
Fig. 5.
Class-level shifts in GBM and transcription in A. millepora. X axes show baseline GBM level averaged across all samples. Y axes shows differential GBM between polyp types (top panels) and differential transcription between polyp types (bottom panels). Top panels: Differential GBM between polyp types was linked with baseline GBM level for the MBD-seq and mdRAD datasets, but not for WGBS. Bottom panels: For all three methylation datasets, the low GBM class of genes was somewhat upregulated in axial compared to radial polyps, and the high GBM class was somewhat downregulated

