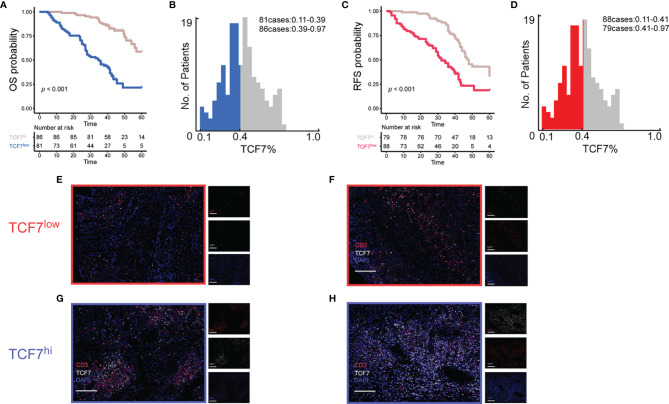
Figure 1.
A total of 167 patients were classified into the TCF7+ T cell low expression group and TCF7+ T cell high expression group based on optimal cutoff values of 0.39 (B) and 0.41 (D) for OS (A) and RFS (C), respectively, using X-tile software. Representative multiplex immunofluorescence results plots were selected in each of the two groups to demonstrate the expression of TCF7+ T cells in the low expression group (E, F) and high expression group (G, H). The markers of fluorescence used were CD3 (red), TCF7 (white), and DAPI (blue). Magnification, 20×; white scale bar, 100 μm; OS, overall survival; RFS, recurrence-free survival.

