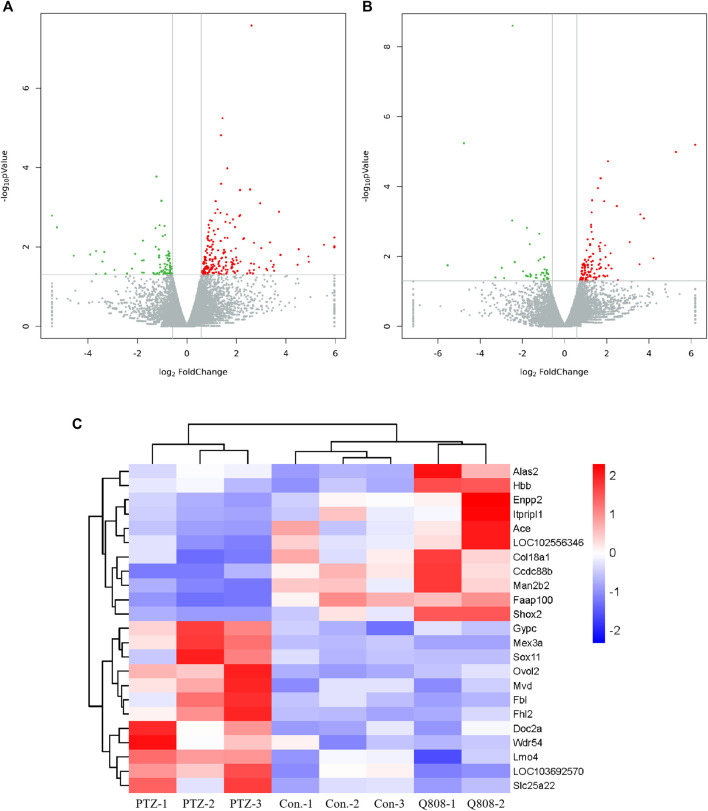
FIGURE 3.
Volcano plot and heatmaps of hub genes in the hippocampus. (A, B) Volcano plot showing up-regulated (red dots) and down-regulated (green dots) DEGs and normal expressed genes (gray dots). (C) Heatmap showing the expression level of 23 hub genes across the three groups. Blue and red colors represent low and high levels of expression, respectively. Corresponding hierarchical clustering analysis of these hub genes is shown in black bars.

