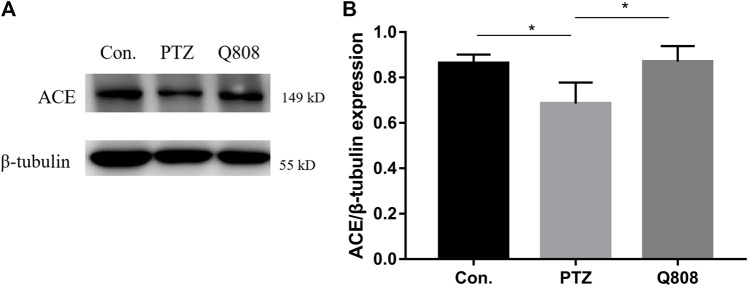
FIGURE 6.
The protein levels of ACE in the hippocampus of rats were determined by Western blot analysis. (A) Representative Western blot bands of ACE. (B) Quantitative analysis of ACE. β-Tubulin was used as the internal control. *p < 0.05. Data are expressed as mean ± SD and analyzed using one-way ANOVA followed by Tukey’s test (n = 3).

