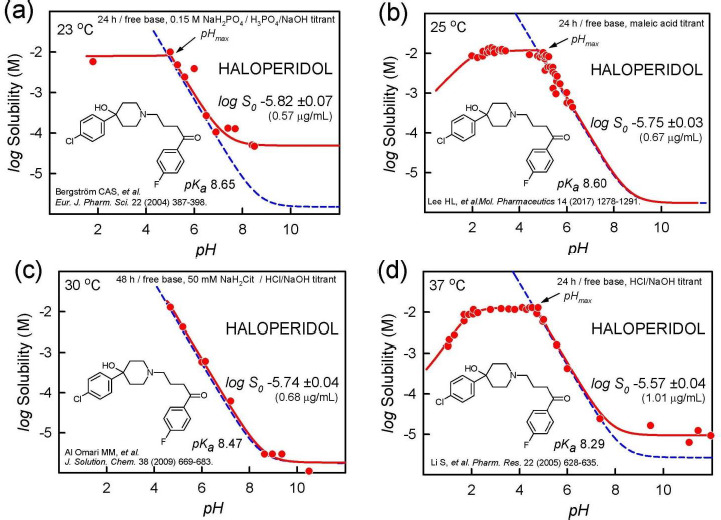
Figure 1.

Haloperidol (free base) log S-pH profiles, illustrating alkaline-region distortions from the shape expected from the Henderson-Hasselbalch equation (dashed blue line). The solid red lines are the best fit to the measured data, using the regression analysis program pDISOL-X [22]. See text for further elaboration.
