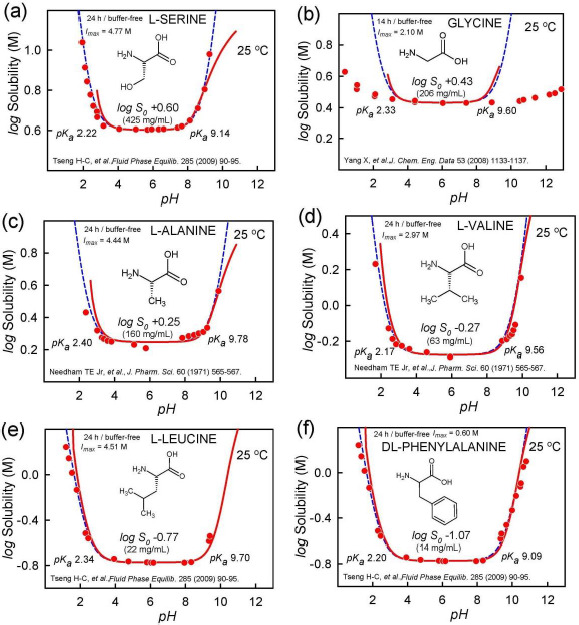
Figure 6.

The solubility-pH profiles of amino acids showing departures from the ideal Henderson-Hasselbalch shape. The distortion is particularly extreme in the case of glycine. Since the data for pH < 4 and pH > 8 were not used in the regression analysis, the listed log S0 values are ‘apparent.’ The actual values may be lower, especially for glycine.
