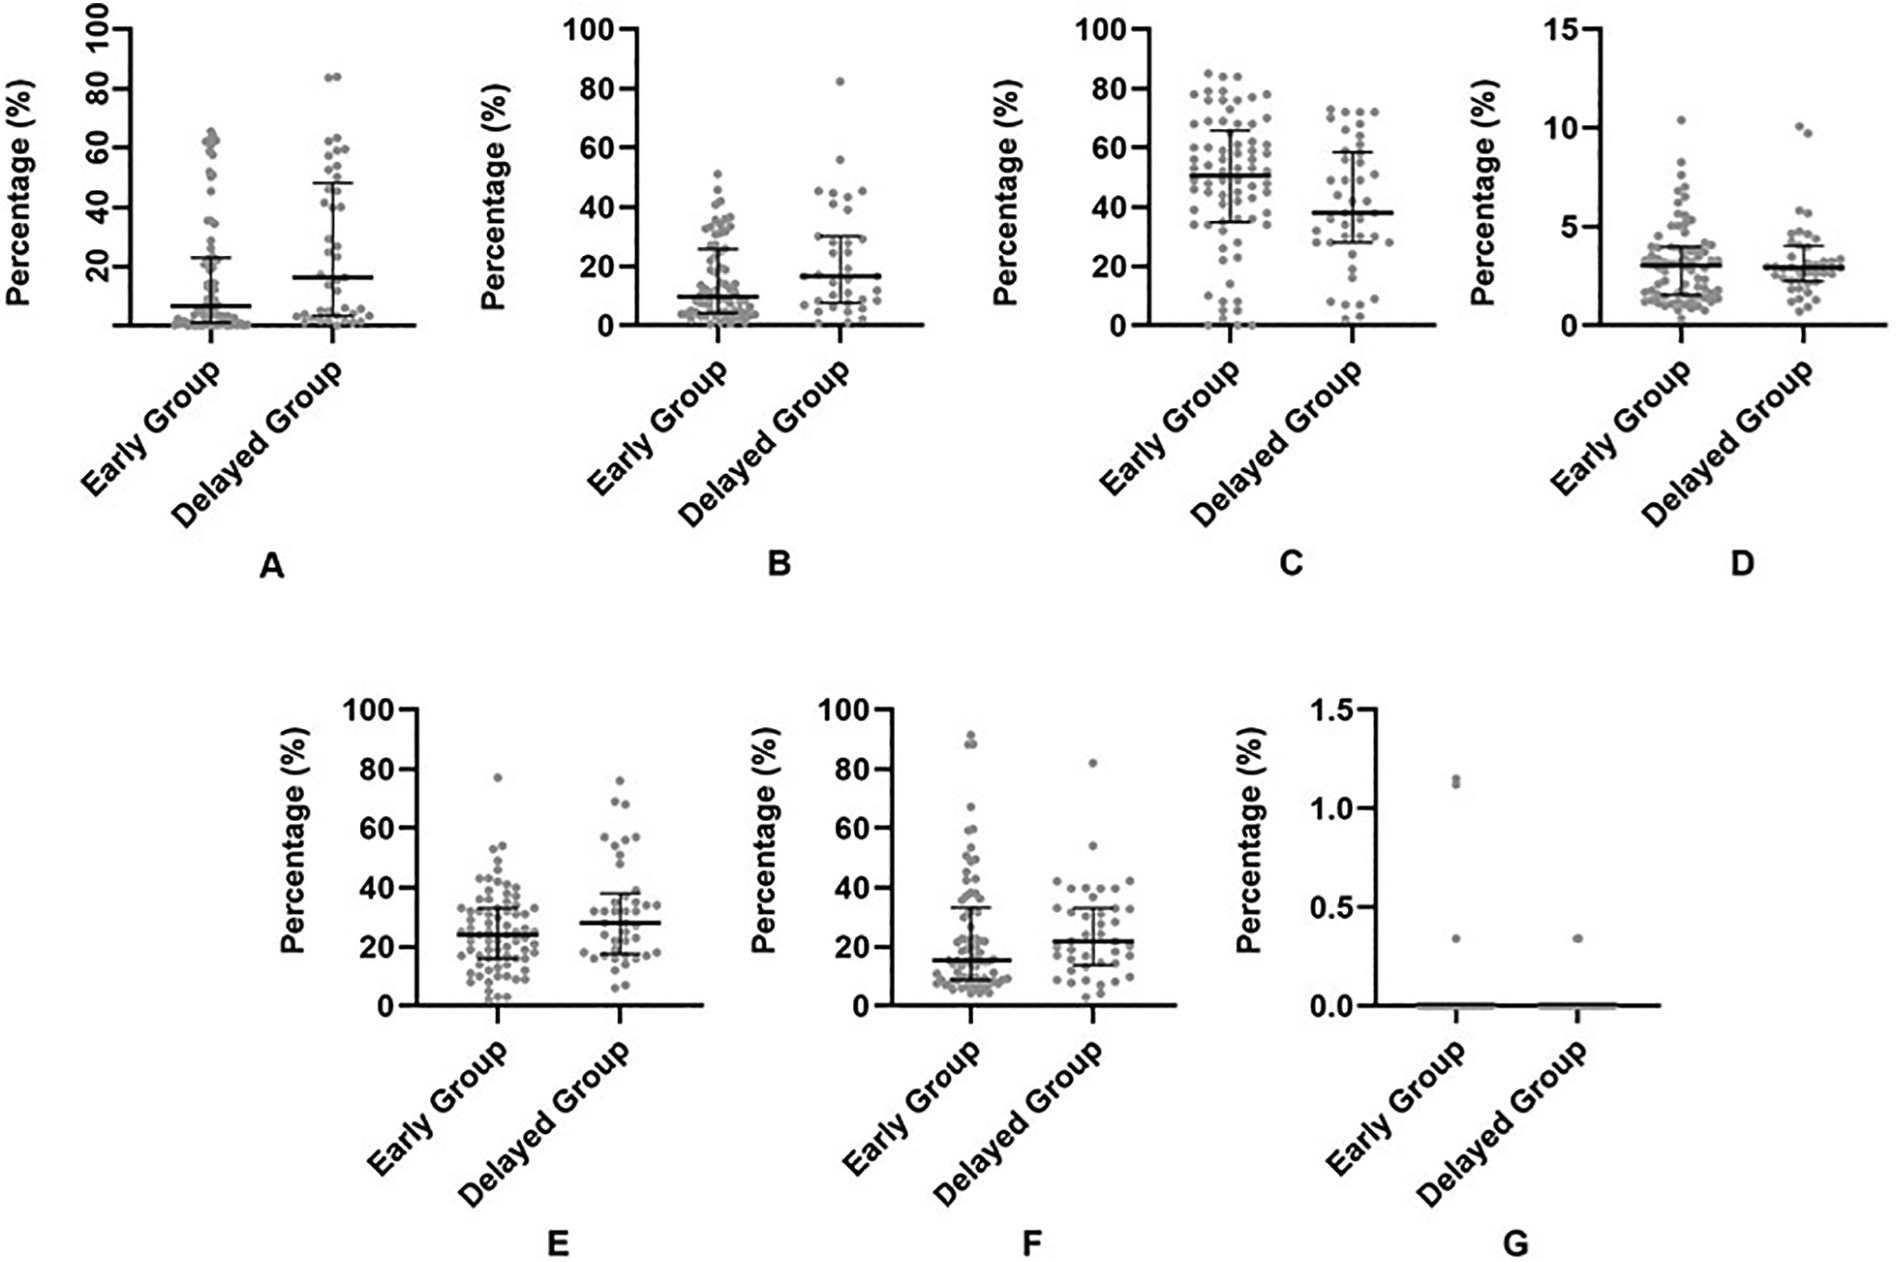
Fig. 1.

Scatter plot (with median and interquartile range) showing the comparison between SOGP less than 4 h (A, Early Group) and SOGP more than 4 h (B, Delayed Group) for each component of thrombus including H3Cit (A), vWF (B), RBCs (C), WBCs (D), Fibrin (E), Platelet (F) and Collagen (G). Independent sample t-test was used for comparison.
