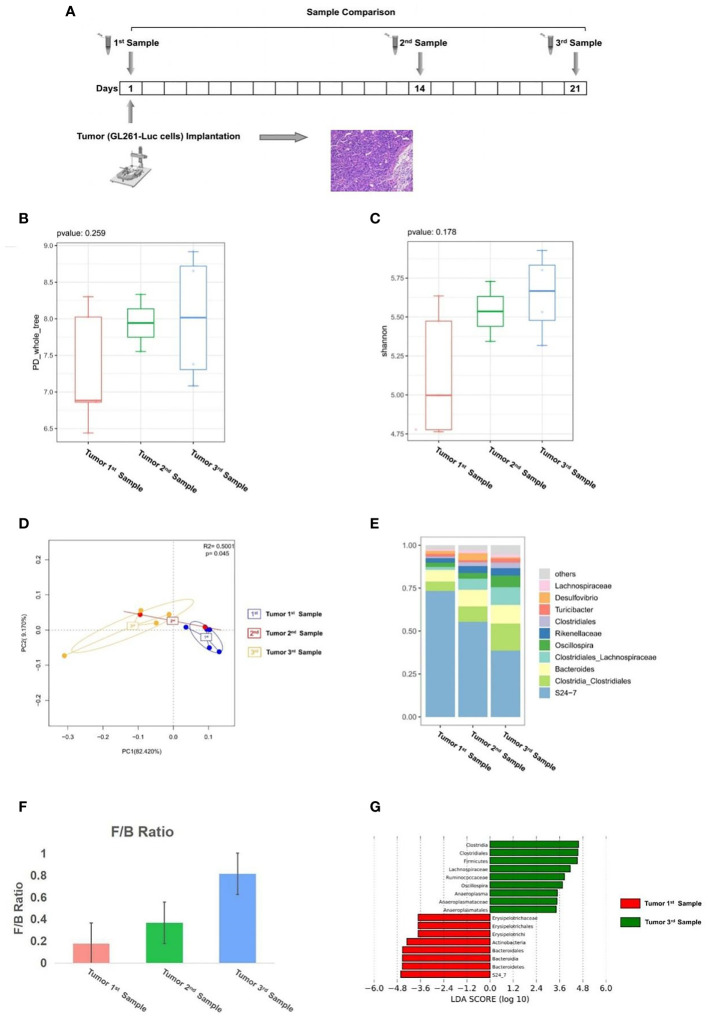
Figure 1.
(A) Experimental design and stool sample collection (first part). (B–G) Glioma growth induced structural changes of gut microbiome in mice. Comparison of tumor 1st to 3rd samples (n = 5). (B) The PD_whole_tree alpha diversity index. (C) The Shannon alpha diversity index. (D) PCoA plot of β-diversity. (E) Taxa analysis. (F) Firmicutes to Bacteroides ratio. (G) Bar plot of LDA score from LEfSe analysis.

