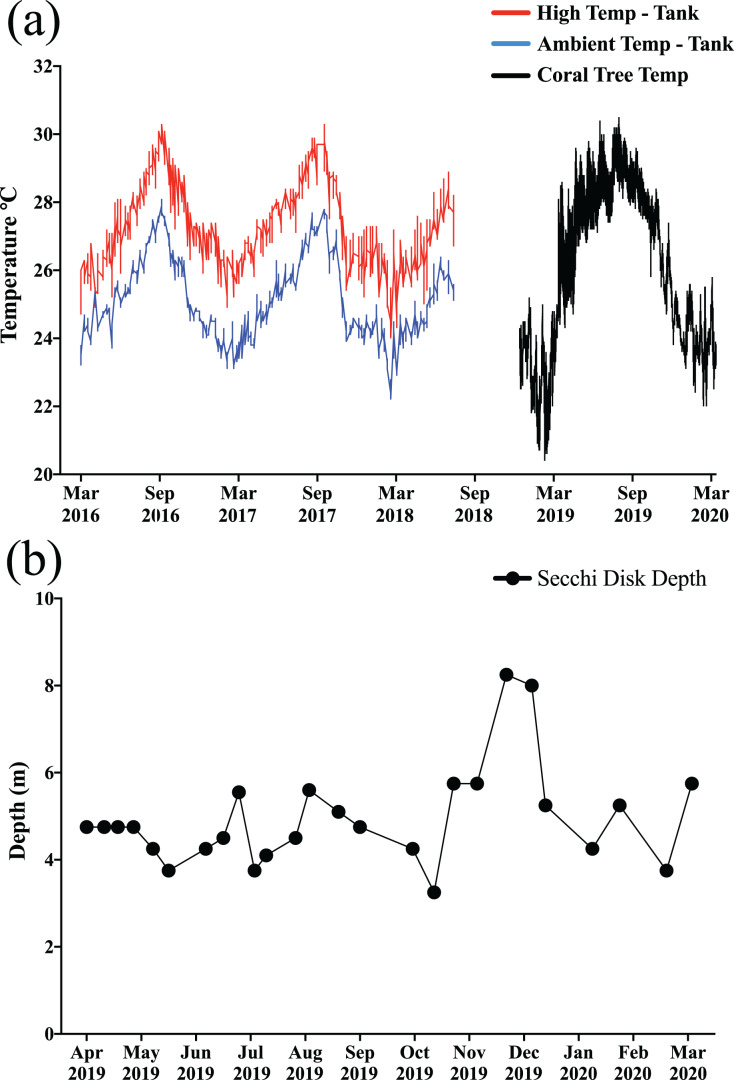
Figure 3. Temperature and water clarity.
(A) The colored lines on the left side of the graph the portray the high (red) and ambient (blue) temperature profiles for the ex situ mesocosms (prior to these experiments), and the in situ temperatures (black) for the coral trees are on the right side of the graph. (B) Secchi disk turbidity readings near coral trees. The in situ exposure covered the entire range of temperatures that the corals experienced in their ex situ mesocosms prior to being transplanted onto the trees. Moreover, except for a few months during the winter, all of the trees experienced a relatively constant, but low light regime, due to turbidity in the bay.

