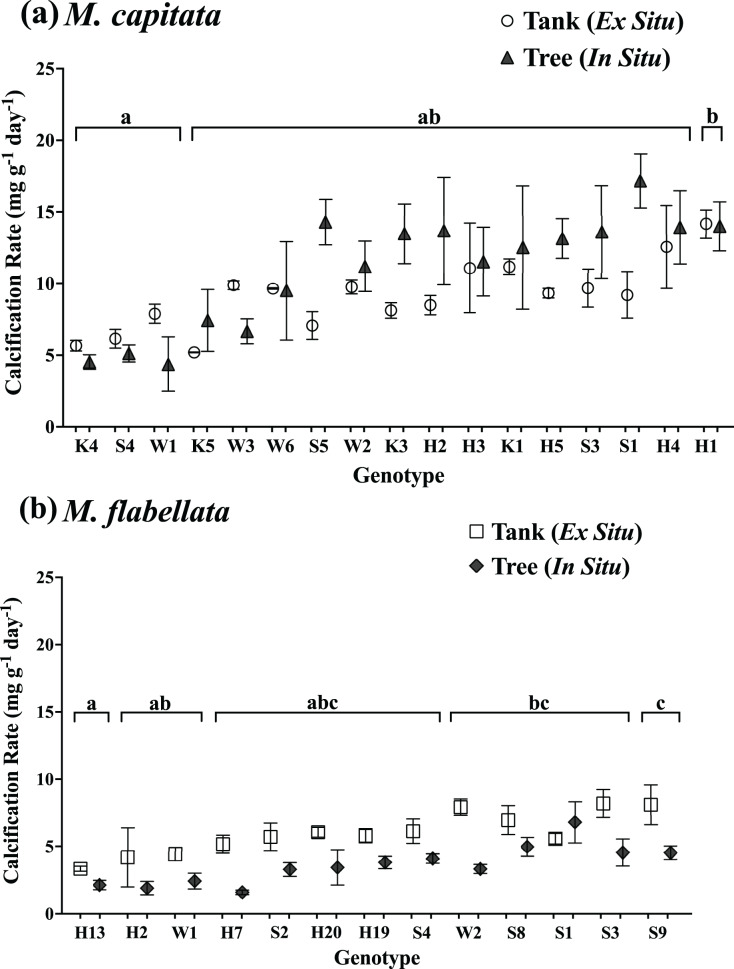
Figure 4. Calcification rate of corals by genotype and culture method.
Comparison of calcification rate by coral genotype and method (tanks vs trees) after 1 year for (A) M. capitata: only genotype main effects were significant (p = 0.0003). (B) M. flabellata: the interaction of culture method and genotype was not significant (p = 0.0930), but the main effects of both genotype and method (p < 0.0001 for both) were. Variation in growth on the trees vs in mesocosms is explained primarily by genotype rather than culture method for M. capitata. For M. flabellata, growth was significantly impacted by culture method and genotype. Error bars are SE, and different letters above groups indicate significant difference in overall calcification genotypes.

