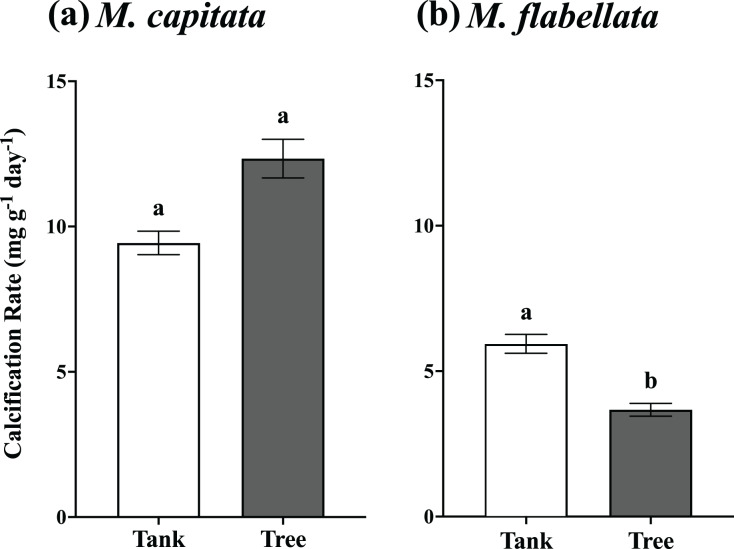
Figure 5. One year mean calcification rate for all fragments, tanks vs trees.
(A) M. capitata: Calcification rate of all fragments on the trees is not significantly greater than tanks after 1 year but is trending toward significance (p = 0.088). (B) M. flabellata: Calcification rate of all fragments in the tanks is greater than on the trees after 1 year (p < 0.0001). The trees demonstrated marginally higher growth for M. capitata, while calcification rate for M. flabellata declined once on the trees. Error bars are SE, and different letters indicate significant difference.

