Fig. 1.
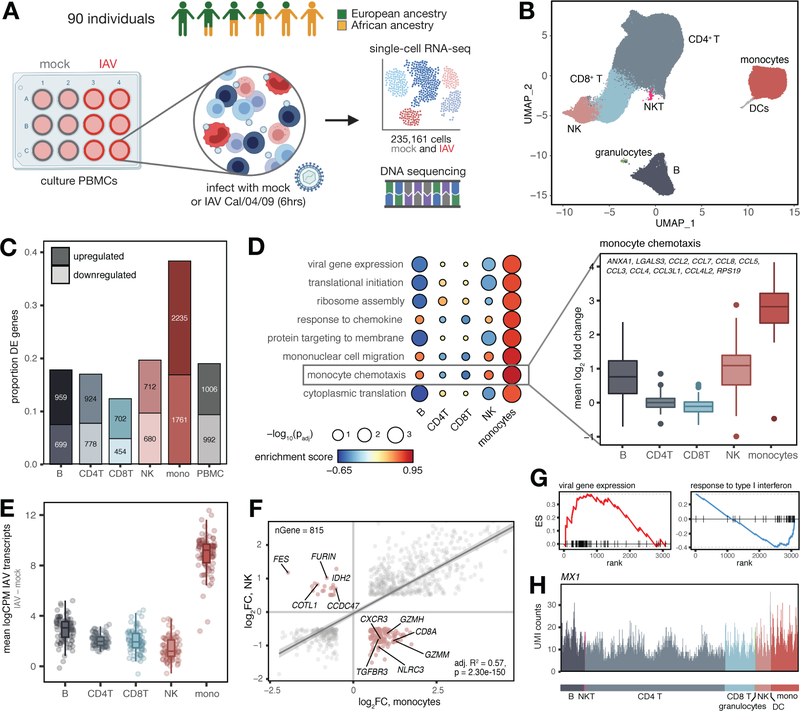
Shared and cell type-specific responses to IAV infection. (A) Study design. (B) UMAP of 235,161 mock and IAV-infected cells across individuals. (C) Numbers and proportions of differentially expressed genes upon infection. (D) Upregulated (FDR < 0.10) monocyte-specific GO pathways following infection (Table S3). “Monocyte chemotaxis” genes display greater upregulation in monocytes (plotted means for each individual across genes in IAV minus mock condition, t-tests, all p-values < 1×10⁻¹⁰ compared to each other cell type). (E) Distribution of IAV transcripts across cell types. (F) Correlation between global infection effect sizes in monocytes and NK cells among DE genes in both cell types (n = 815). P-value and best-fit slope was obtained from a linear regression model. Highlighted genes (pink) display discordant responses. (G) Example pathways enriched among genes with high (viral gene expression) and low (response to type I interferon) specificity scores. Genes are rank-ordered by specificity score (x-axis, highest to lowest). (H) UMI counts per cell in the IAV-infected condition for an example IFN-inducible gene (MX1) with a ubiquitous expression pattern.

