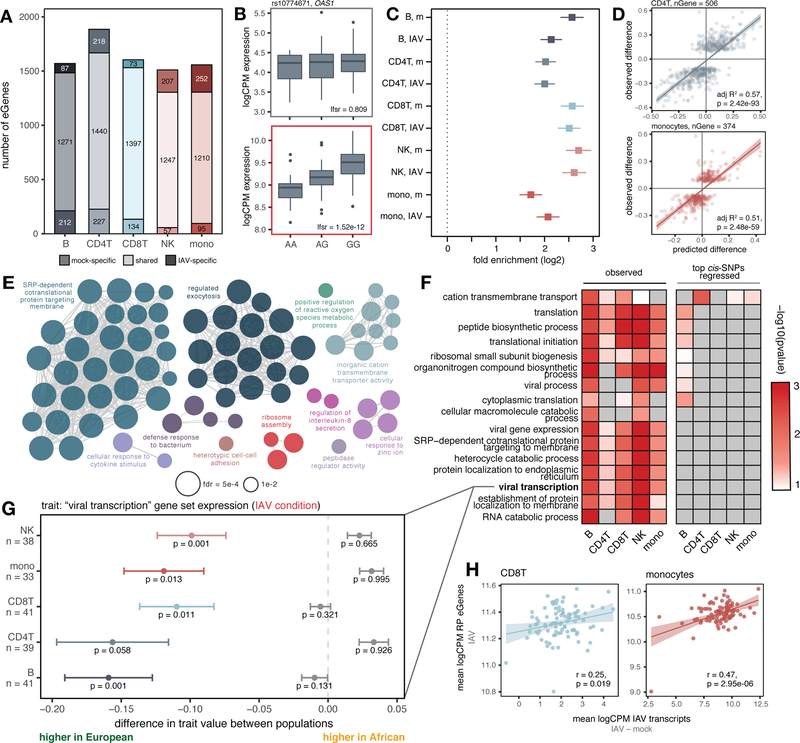
Fig. 3.
Cis-regulatory variation drives differences in the antiviral response. (A) Number of shared and condition-specific eGenes. (B) Condition-specific eQTL example (rs10774671) in CD4+T cells (top: mock, bottom: IAV-infected). (C) Enrichment of eGenes among popDE genes in each cell type/condition determined using logistic regression (log2-fold enrichment with 95% confidence interval; “m” = mock). (D) Correlation of cis-predicted (x-axis) versus observed (y-axis) population differences in expression among popDE genes with an eQTL in CD4+T cells and monocytes. (E) Significant ClueGO enrichments (hypergeometric test, FDR < 0.01) for popDE eGenes across cell types in the IAV-infected condition. (F) Heatmap of −log10 p-values in support of median ancestry-associated differences in gene expression among a subset of enriched GO terms (left) and a model estimating this effect after regressing out the effects of the top cis-SNPs for all genes contained in the term (right). (G) Example of a GO term for which patterns of population variation are compatible with polygenic selection. PopDE genes with an eQTL that belong to the GO term “viral transcription” (n range = 33 – 41 genes) show consistently higher expression levels in European-ancestry individuals (median observed ancestry-associated difference (x-axis) < 0, colored points +/− SE). Following cis-SNP regression (gray points +/− SE), the overall trend for higher expression of viral transcription genes in European- compared to African-ancestry individuals is no longer significant. Empirical p-values were calculated using a permutation-based approach for (F) and (G) ((10) for details). (H) Correlation between IAV transcripts and ribosomal protein eGene expression in CD8+T cells and monocytes. In (D) and (H), p-values and best-fit slopes were obtained from linear regression models.

