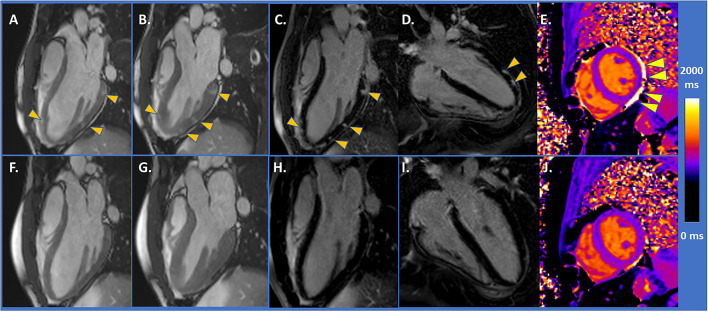
Figure 1.
(A,B) CMR demonstrated mildly impaired LV-function and areas of higher contrast-to-noise ratio (arrowheads) with SSFP images. (C,D) With LGE images, abundant subepicardial LGE was detected (arrowheads). (E) Native T1 value was within normal range (T1 = 1,000 ms, arrowheads depicting small pericardial effusion). (F,G) Control CMR after 3 months showing full functional recovery and disappearance of LGE in (H,I). (J) T1 value of 990 ms.

