
Figure 3: Ate1 regulates glycolysis and HIF1α signaling.
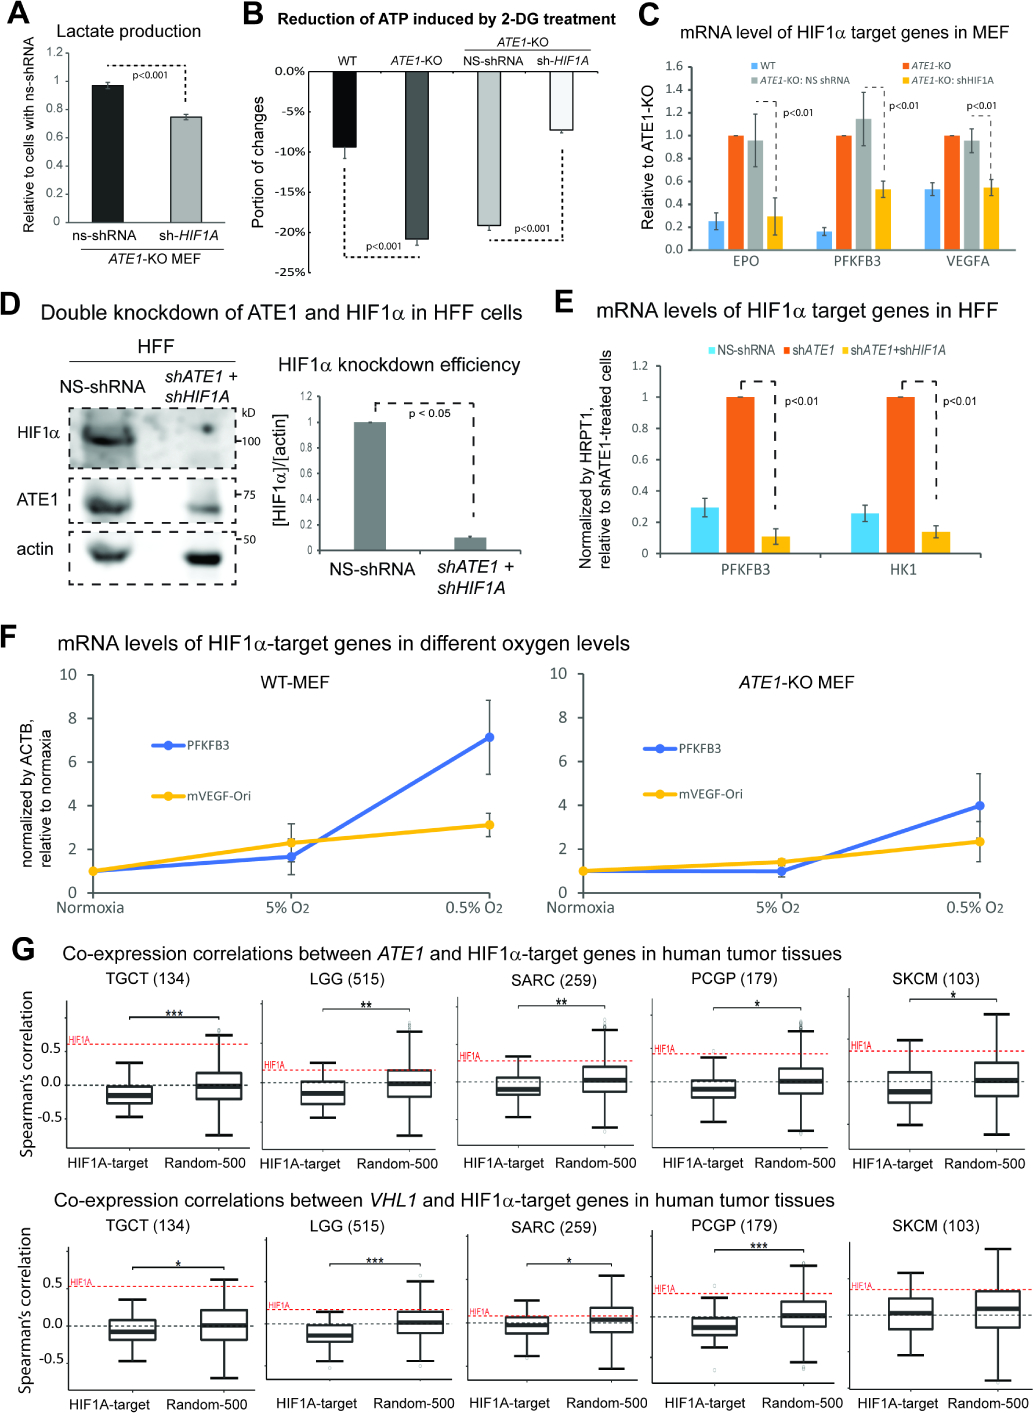
A) Lactate secretion in the media over 24 hours for ATE1-KO MEF with HIF1α-specific or NS shRNA (n=4).
B) The 2-DG-induced ATP reduction in MEF WT, ATE1-KO, ATE1-KO with NS- or HIF1α-specific shRNA (n=5).
C) The mRNA levels of HIF1α-target genes EPO, PFKFB3 and VEGFA in MEFs of WT, ATE1-KO, ATE1-KO with NS- or HIF1A-shRNA. Quantified by quantitative RT-PCR using 18S rRNA as a loading control (n=3).
D) Representative immunoblot and quantification (n=3) showing the efficiency of a double knockdown of HIF1A and ATE1, in HFF.
E) The mRNA levels of HIF1α-target genes, PFKFB3 and hexokinase-1 (HK1), in HFF treated with either: NS-shRNA, ATE1-shRNA, or ATE1- + HIF1A-shRNAs. Human hypoxanthine phosphoribosyltransferase 1 (HPRT1) was used as a loading control in quantitative PCR (n=3).
F) Graphs showing for mRNA levels measured by qPCR (n=3) of HIF1α-target genes PFKFB3 and VEGFA in WT and ATE1-KO MEF: challenged with different O2 concentrations for 6 hours. ACTB was used as a loading control. The levels of these genes in normoxia (18% in cultured cells) were used as normalization points for individual series of data.
G) Box whisker plots showing the Spearman’s correlations of mRNA expressions of ATE1 (or VHL) with 50 validated HIF1α-activating target genes (see Suppl Table S1 for the list) in tumor tissues in The Cancer Genome Atlas (TCGA). A random set of 500 genes (Random-500)(Li et al., 2012, Soler-Oliva et al., 2017, Zhao and Liu, 2019) was used as control for HIF1α-targets. The examined tissues include testicular germ cell tumors (TGCT), low grade glioma (LGG), sarcoma (SARC), Pheochromocytoma and Paraganglioma (PCPG), and skin cutaneous melanoma (SKCM); their sample sizes are indicated in parentheses. The co-expression correlation between ATE1 (or VHL) and HIF1A in each sample set are also illustrated as a red dotted line on the plot. The significance (p-value) was calculated by Mann−Whitney U test. The symbols *, **, and *** indicate p-values of <0.05, <0.005, and <0.0005, respectively.