
Figure 6. Arginylation of HIF1α is sensitive to the oxygen-dependent hydroxylation on this protein.
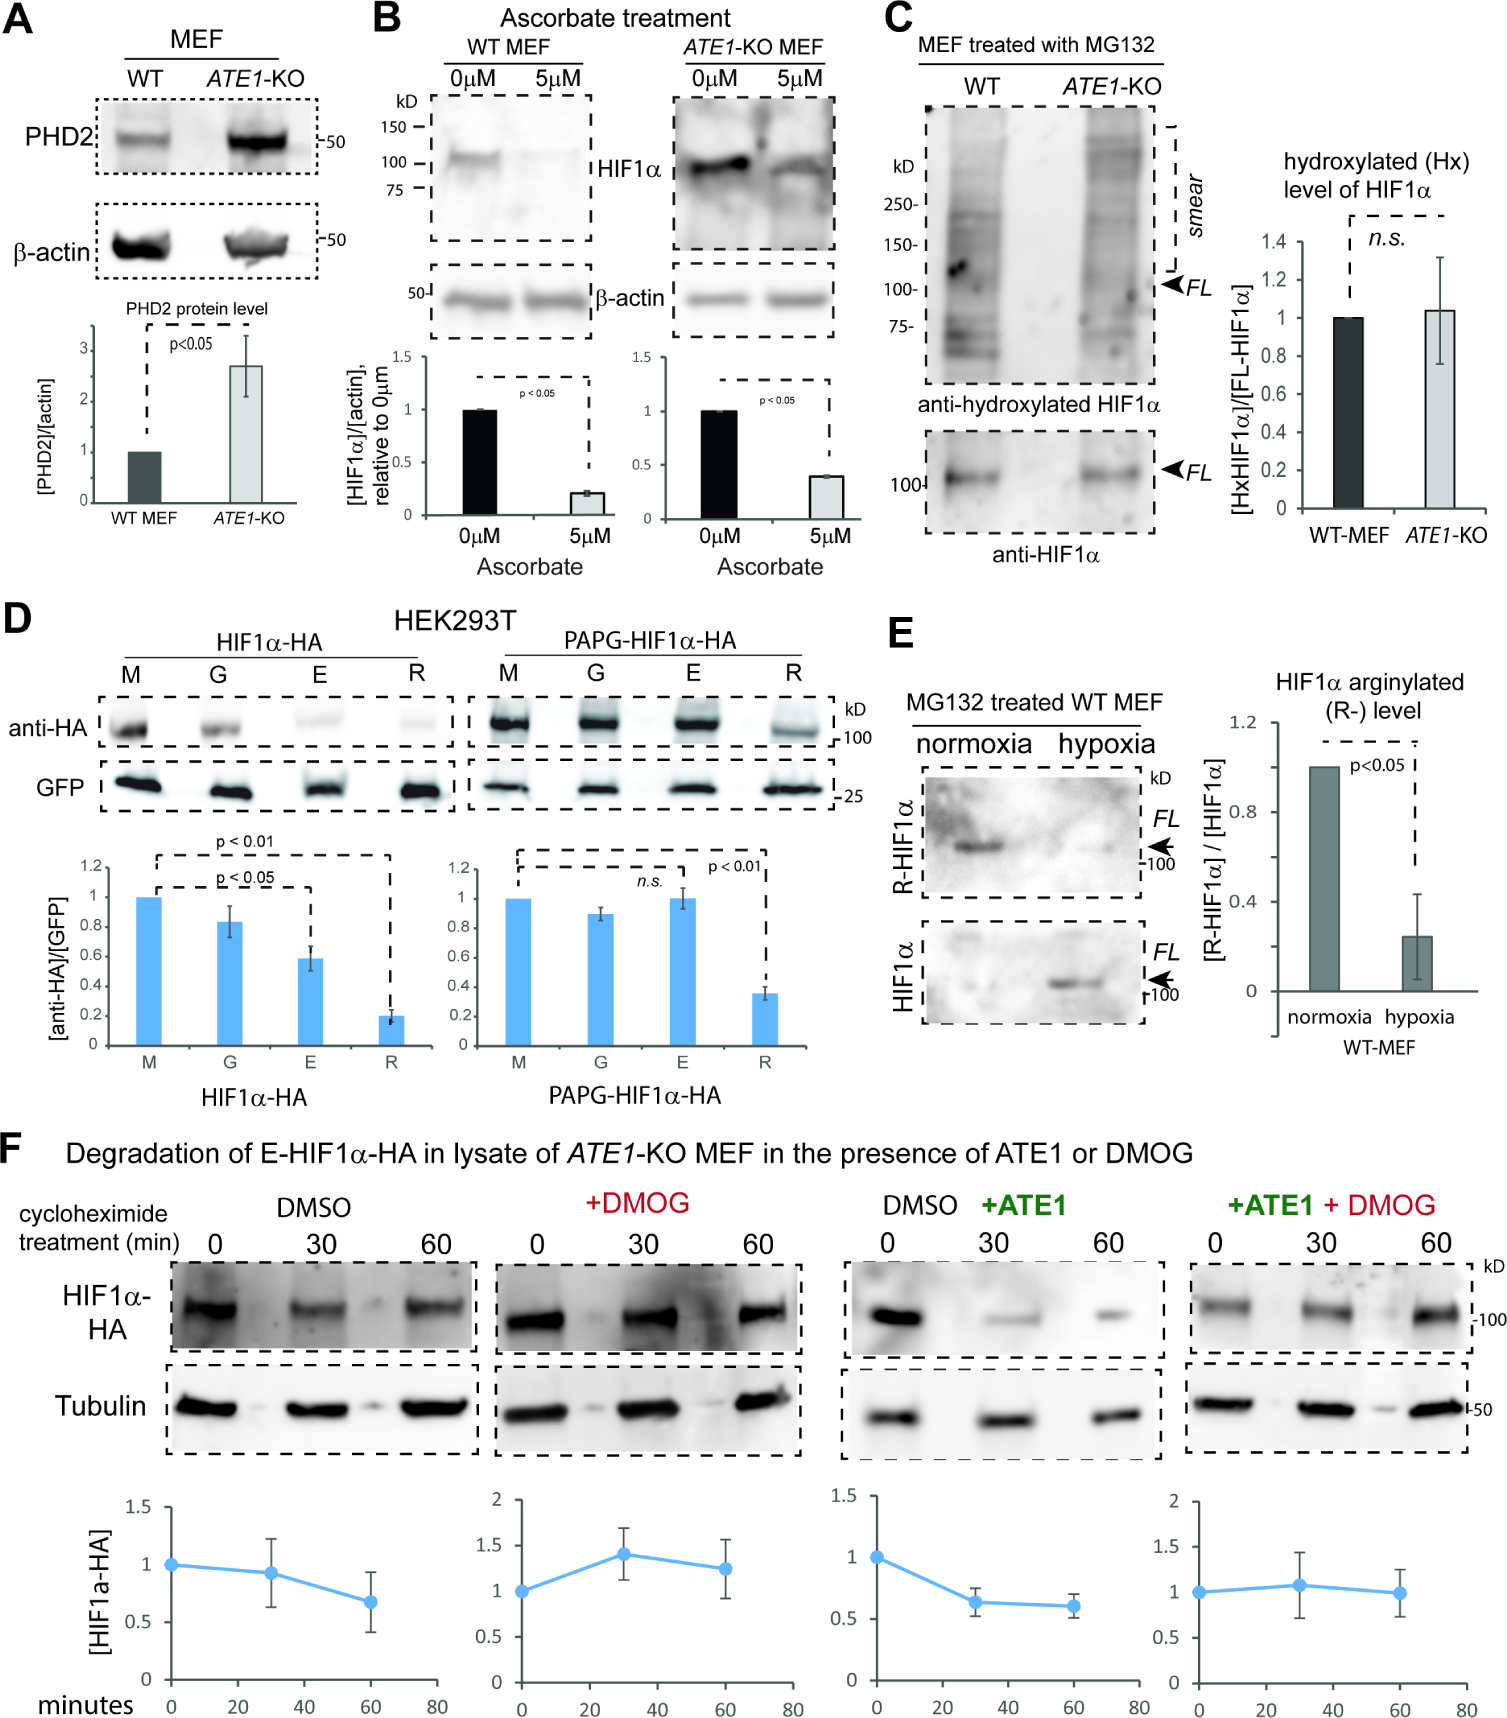
A) Immunoblots of PHD2 protein and quantification (n=3) in WT and ATE1-KO MEF with β-actin as loading controls.
B) The level of HIF1α (and β-actin) in WT and ATE1-KO MEF treated with either 5μM L-Ascorbic acid 2-phosphate (a co-factor and co-activator for PHD) or DMSO (as reagent control) for 24 hours. Under each set of immunoblots is the graph showing the fold changes of HIF1a in ascorbate-treated group (5μM), relative to the control group (0μM) (n=3).
C) Immunoblots on the left shows the P564-hydroxylated (Hx-) HIF1α, probed with rabbit anti hydroxyl-HIF1α (Cell Signaling, Danvers, MA, Cat# 3434), in WT and ATE1-KO MEF treated with MG132 for 6 hrs. The positions of full-length (FL) HIF1α and the ubiquitinylated-smear are indicated. The loading amounts were pre-adjusted to reach equivalent levels of FL HIF1α in each lane; these were determined by loading on a different gel to avoid signal bleed-through, because both the anti-HIF1α and the anti hydroxyl-HIF1α were rabbit antibodies. The graph on the right shows the level of P564-hydroxylated HIF1α in proportion to FL-HIF1α (n=4). See Suppl Fig. 5A for the validation of the specificity of the antibody for hydroxyl-HIF1α. See also Suppl Fig. S5B for the detection of hydroxyl-HIF1α with a different antibody.
D) Steady-state levels of M-, G-, E-, or R- HIF1α with or without PAPG mutations transiently expressed in HEK293T cells. Graph shows quantification with GFP as controls for loading and transfection efficiency (n=8).
E) Endogenous arginylated (R-) HIF1α in WT MEF, under different O2 levels, probed by the custom-made arginylation-specific antibody as described in Fig.3D. The cells were pre-cultured in normoxia (18% O2) or hypoxia (0.5% O2) for at least 2 hrs followed by MG132 addition and allowed to culture for 9 hrs. Arrows point to the expected size of the full-length (FL) HIF1α. The level of total HIF1α, probed by anti-HIF1α, was used to calculate the ratio of arginylation signal. The graph on the right side shows quantifications (n=3).
F) Cycloheximide time-chase for E-HIF1α–HA in the lysate of ATE1-KO MEF, with the addition of recombinant mouse ATE1 isoform 1 (or buffer) and 1mM DMOG (an inhibitor of PHD) or DMSO, as a vehicle control. Tubulin serves as a loading control. Graphs on bottom show quantification (n>=3). See also Supp Fig. S5C for the validation of the effectiveness of DMOG on endogenous HIF1α. See also Suppl Fig. S5D for the lack of effect of DMOG on the recombinant HIF1α bearing the PAPG mutation that blocks proline hydroxylation.
See also Suppl Fig. S6 for the mutation burdens in ATE1, UBRs and VHL genes in tumor samples.