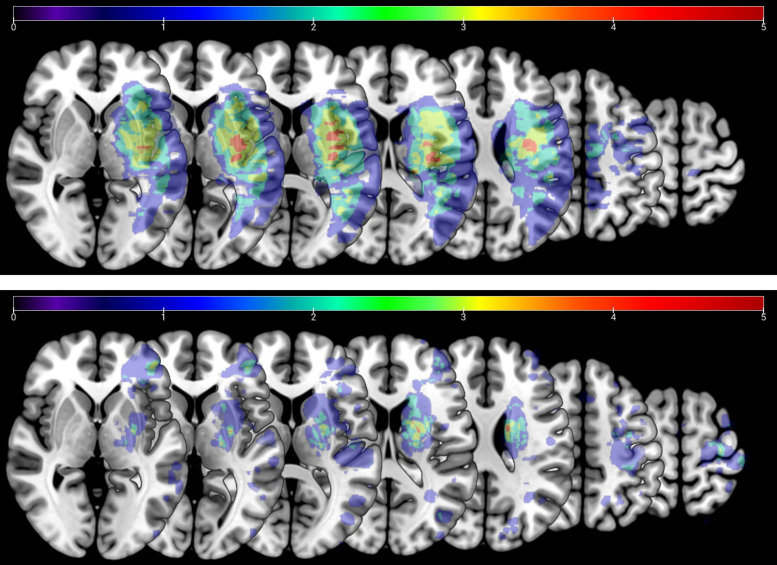
Figure 2.
Lesion distribution overlay for chronic (top, n = 10) and subacute (bottom, n = 19) patients with moderate/mild Fugl-Meyer scale for the upper extremity (FM-UE) impairment (FM-UE ≥ 26). Averaged lesion distribution mapped to Johns Hopkins University-Montreal Neurological Institute (MNI) space, with lesion flipped to one hemisphere. Color bar indicates patient count.

