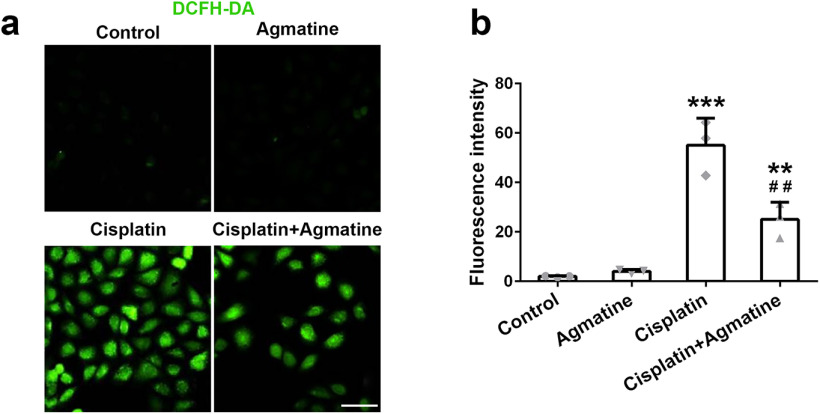
Figure 2.
The intracellular level of ROS in HEI-OC1 cells was detected with DCFH-DA staining. a, Fluorescent images from different groups. b, Fluorescence intensity was measured with ImageJ software. Data were represented as mean ± SD, n = 3; **p < 0.01, ***p < 0.001 compared with control group; ##p < 0.01 compared with cisplatin group. Scale bar: 50 μm.

