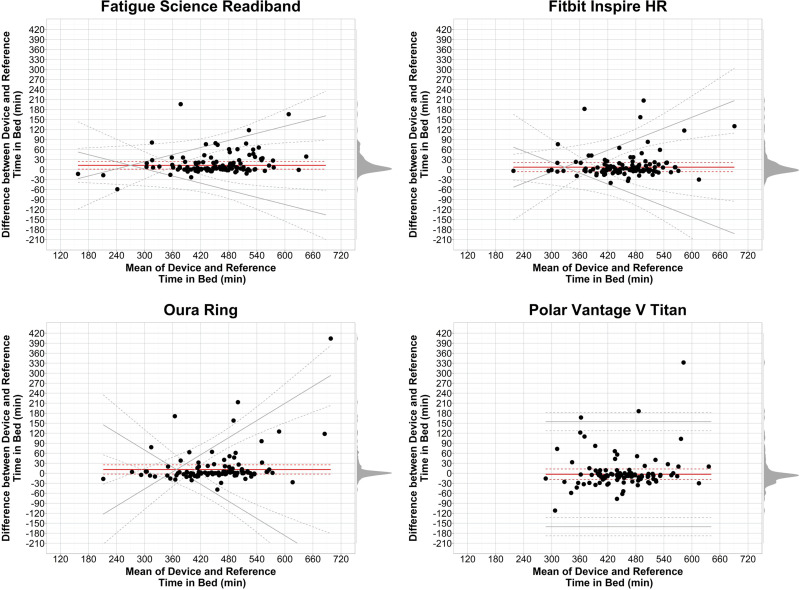
Figure 1.
Bland-Altman plots: TIB.
Notes: Plots depict the mean bias (solid red line) and upper and lower limits of agreement (solid gray lines) for deviation in TIB for the devices compared with the reference sleep diary. Black circles are individual nights. Dashed lines represent the 95% confidence intervals around the bias and limits of agreement lines. Gray shaded regions on the right y-axis are density plots showing the distribution of individual night biases. Zero on the y-axis represents no difference, with positive and negative y-axis values indicating an overestimation or underestimation, respectively, compared with the reference. Diagonal mean bias lines indicate significant proportional bias. Non-parallel limits of agreement lines indicate significant heteroscedasticity.
Abbreviation: TIB, time in bed.

