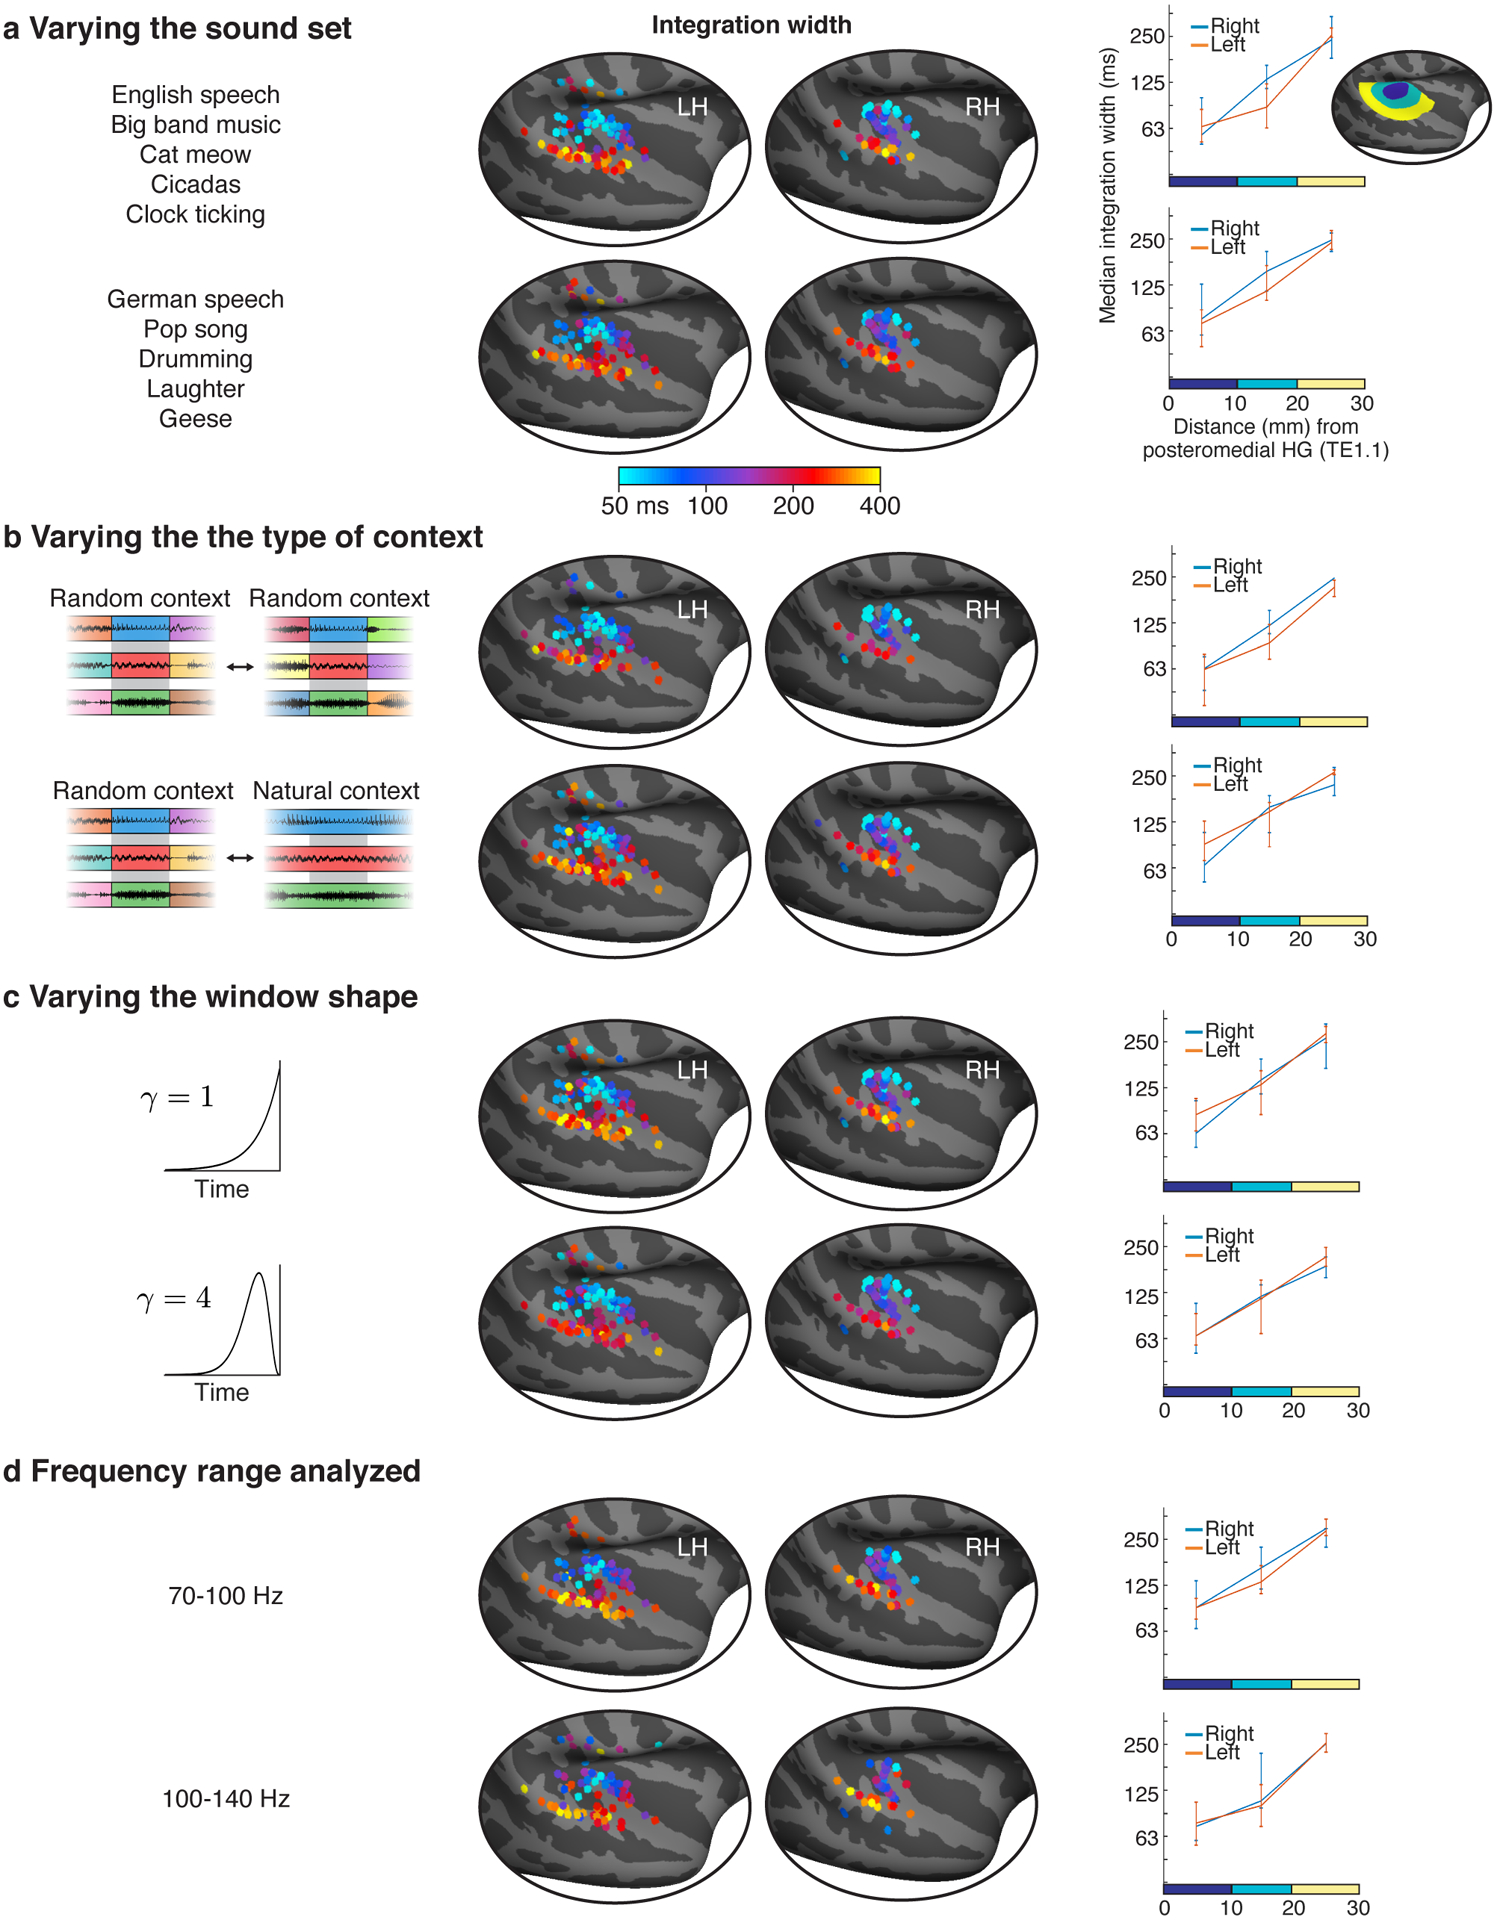
Extended Data Fig. 5. Robustness analyses.

a, Sound segments were excerpted from 10 sounds. This panel shows integration windows estimated using segments drawn from two non-overlapping splits of 5 sounds each (listed on the left). Since many non-primary regions only respond strongly to speech or music8,9,11, we included speech and music in both splits. Format is analogous to Figure 4 but only showing integration widths (integration centers were also similar across analysis variants). The effect of distance was significant for both splits (split1: F1,12.660 = 40.20, p < 0.001, βdistance = 0.069 octaves/mm, CI = [0.047, 0.090], N=136 electrodes; split 2: F1,21.66 = 30.11, p < 0.001, βdistance = 0.066 octaves/mm, CI = [0.043, 0.090], N=135 electrodes). b, Shorter segments were created by subdividing longer segments, which made it possible to consider two types of context (see schematic): (1) random context, in which each segment is surrounded by random other segments (2) natural context, where a segment is a subset of a longer segment and thus surrounded by its natural context. When comparing responses across contexts, one of the two contexts must be random so that the contexts differ, but the other context can be random or natural. Our main analyses pooled across both types of comparison. Here, we show integration widths estimated by comparing either purely random contexts (top panel) or comparing random and natural contexts (bottom panel). The effect of distance was significant for both types of context comparisons (random-random: F1,28.056 = 30.01, p < 0.001, βdistance = 0.064 octaves/mm, CI = [0.041, 0.087], N=121 electrodes; random-natural: F1,18.816 = 27.087, p < 0.001, βdistance = 0.062 octaves/mm, CI = [0.039, 0.086], N=154 electrodes). c, We modeled integration windows using window shapes that varied from more exponential to more Gaussian (the parameter γ in equations 2&3 controls the shape of the window, see Methods). For our main analysis, we selected the shape that yielded the best prediction for each electrode. This panel shows integration widths estimated using two different fixed shapes. The effect of distance was significant for both shapes (γ = 1: F1,21.712 = 24.85, p < 0.001, βdistance = 0.067 octaves/mm, CI = [0.040, 0.093], N=154 electrodes; γ = 4: F1,20.973 = 19.38, p < 0.001, βdistance = 0.055 octaves/mm, CI = [0.031, 0.080], N=154 electrodes). d, Similar results were obtained using two different frequency ranges to measure gamma power (70–100s Hz: F1,21.05 = 19.38, p < 0.001, βdistance = 0.058 octaves/mm, CI = [0.032, 0.083], N=133 electrodes; 100–140 Hz: F1,20.56 = 12.57, p < 0.01, βdistance = 0.051 octaves/mm, CI = [0.023, 0.080], N=131 electrodes).
