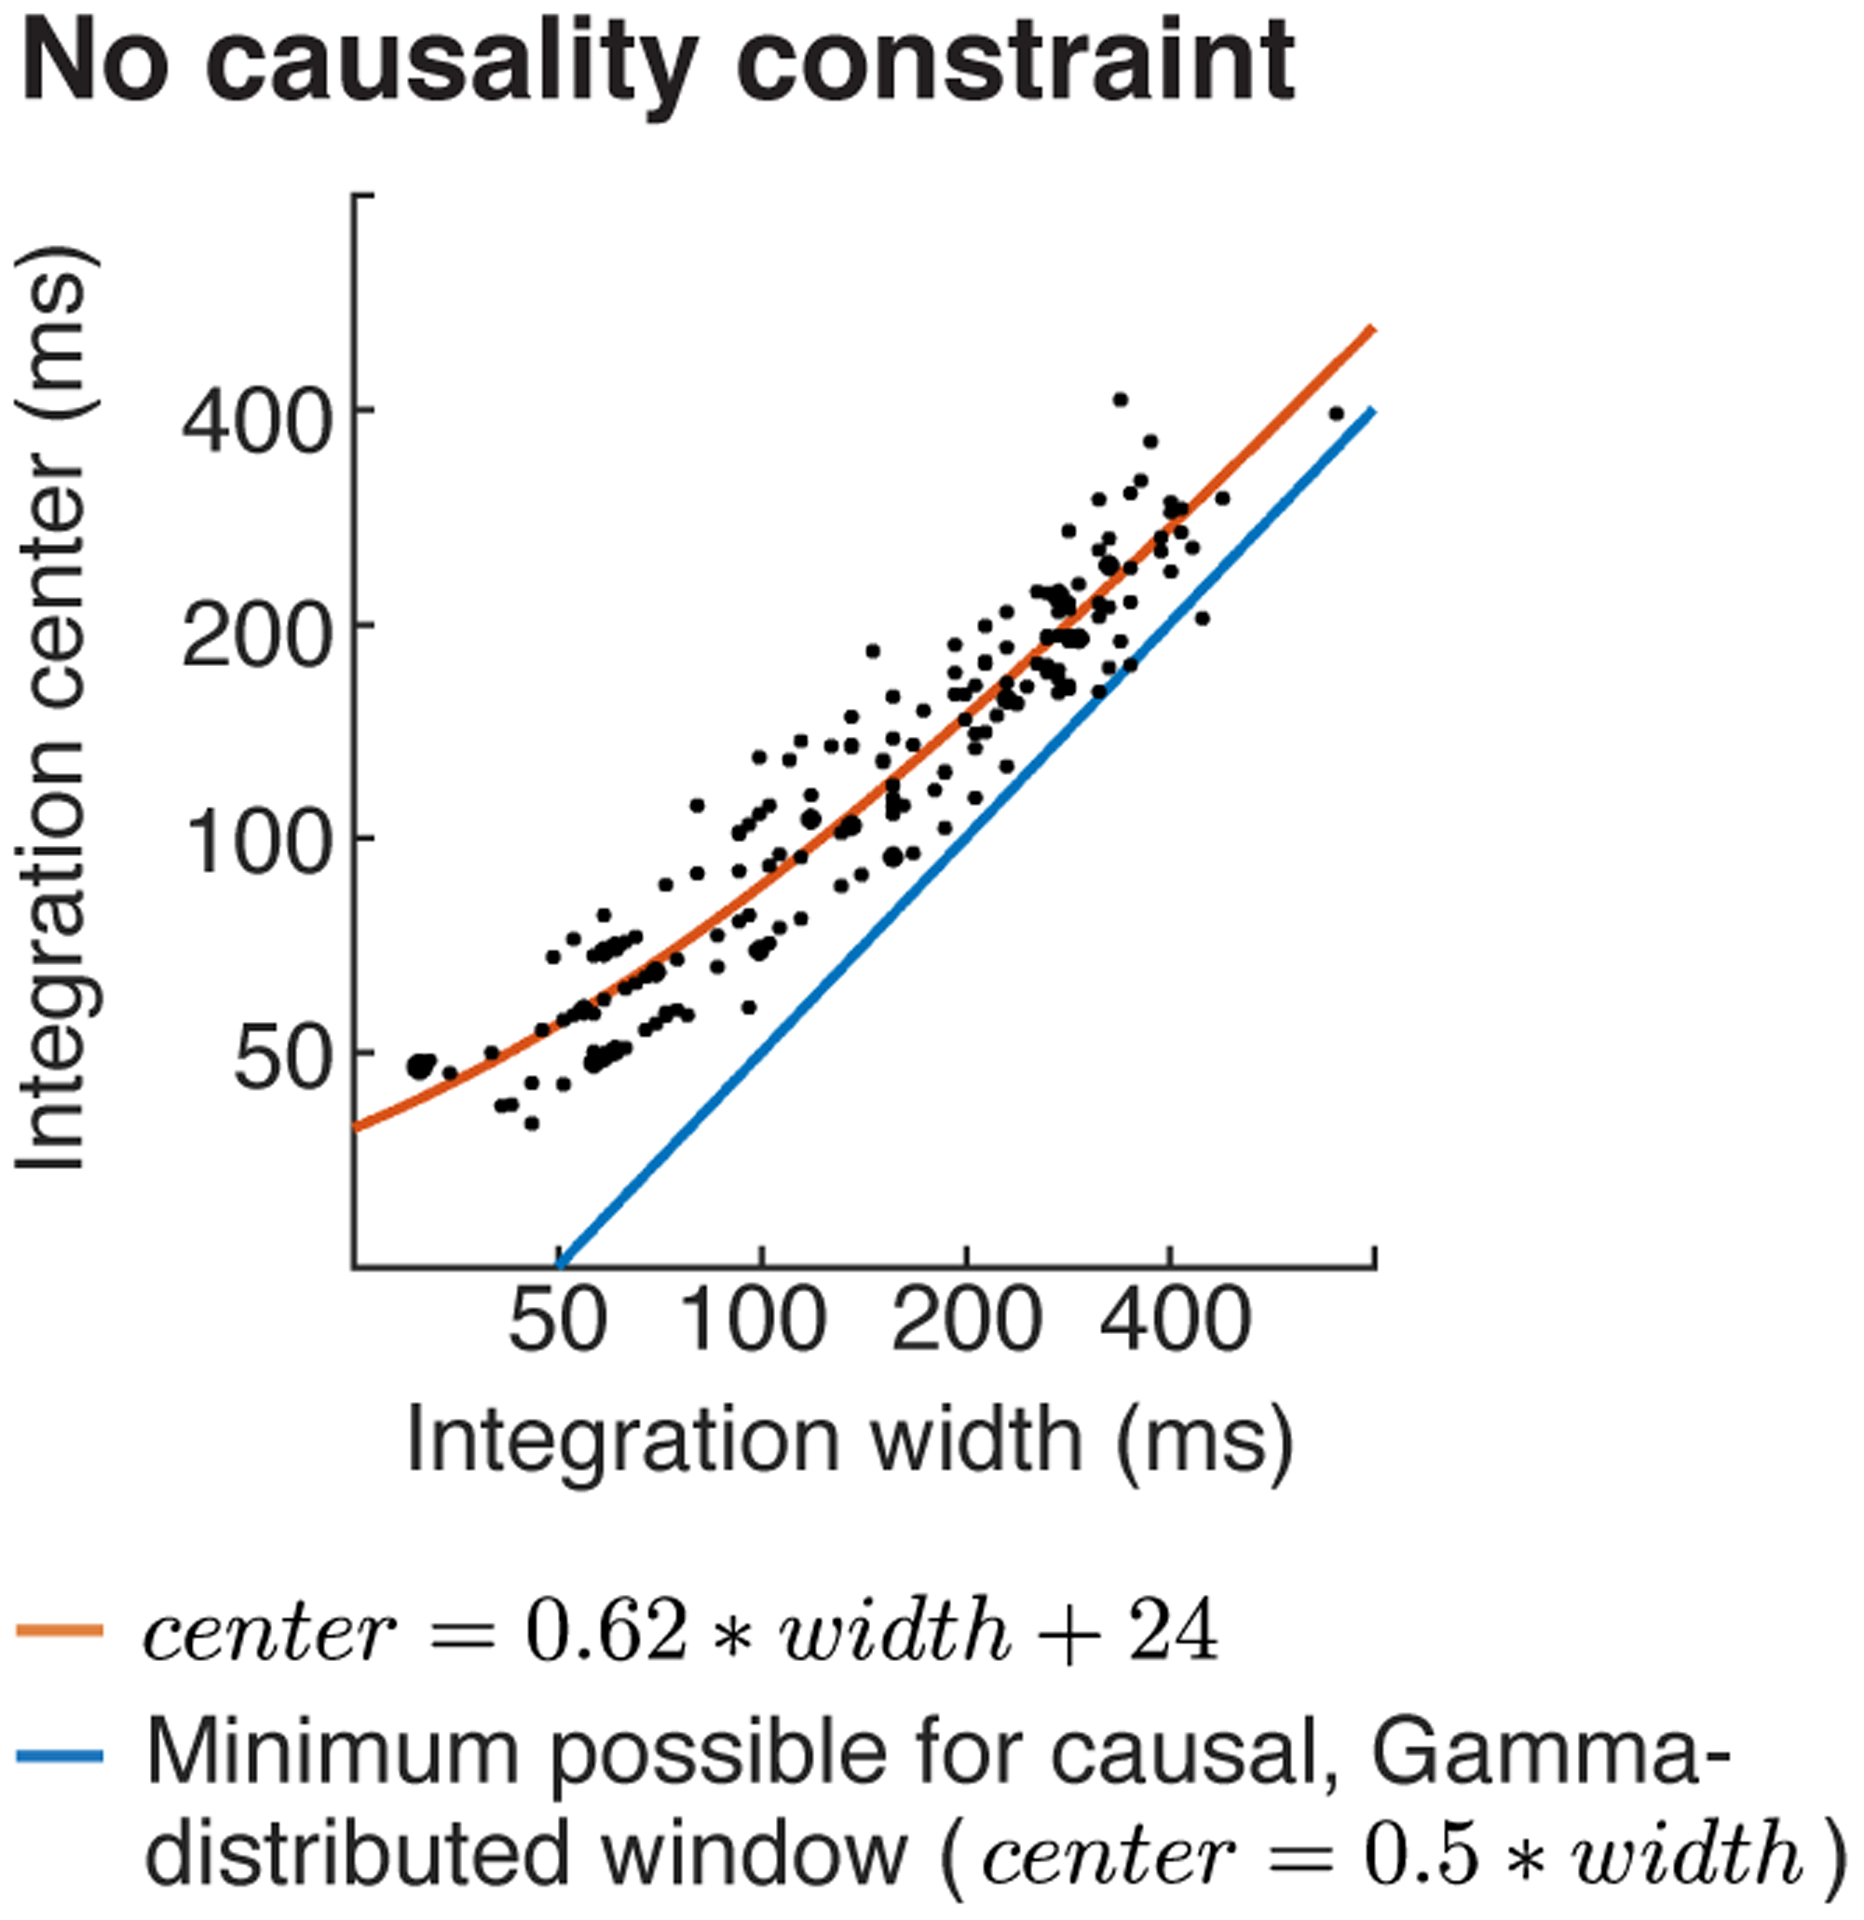
Extended Data Fig. 6. Relationship between integration widths and centers without any causality constraint.

This figure plots integration centers vs. widths for windows that were not explicitly constrained to be causal. Results were similar to those with an explicit causality constraint (Fig 4c). Same format as Figure 4c.
