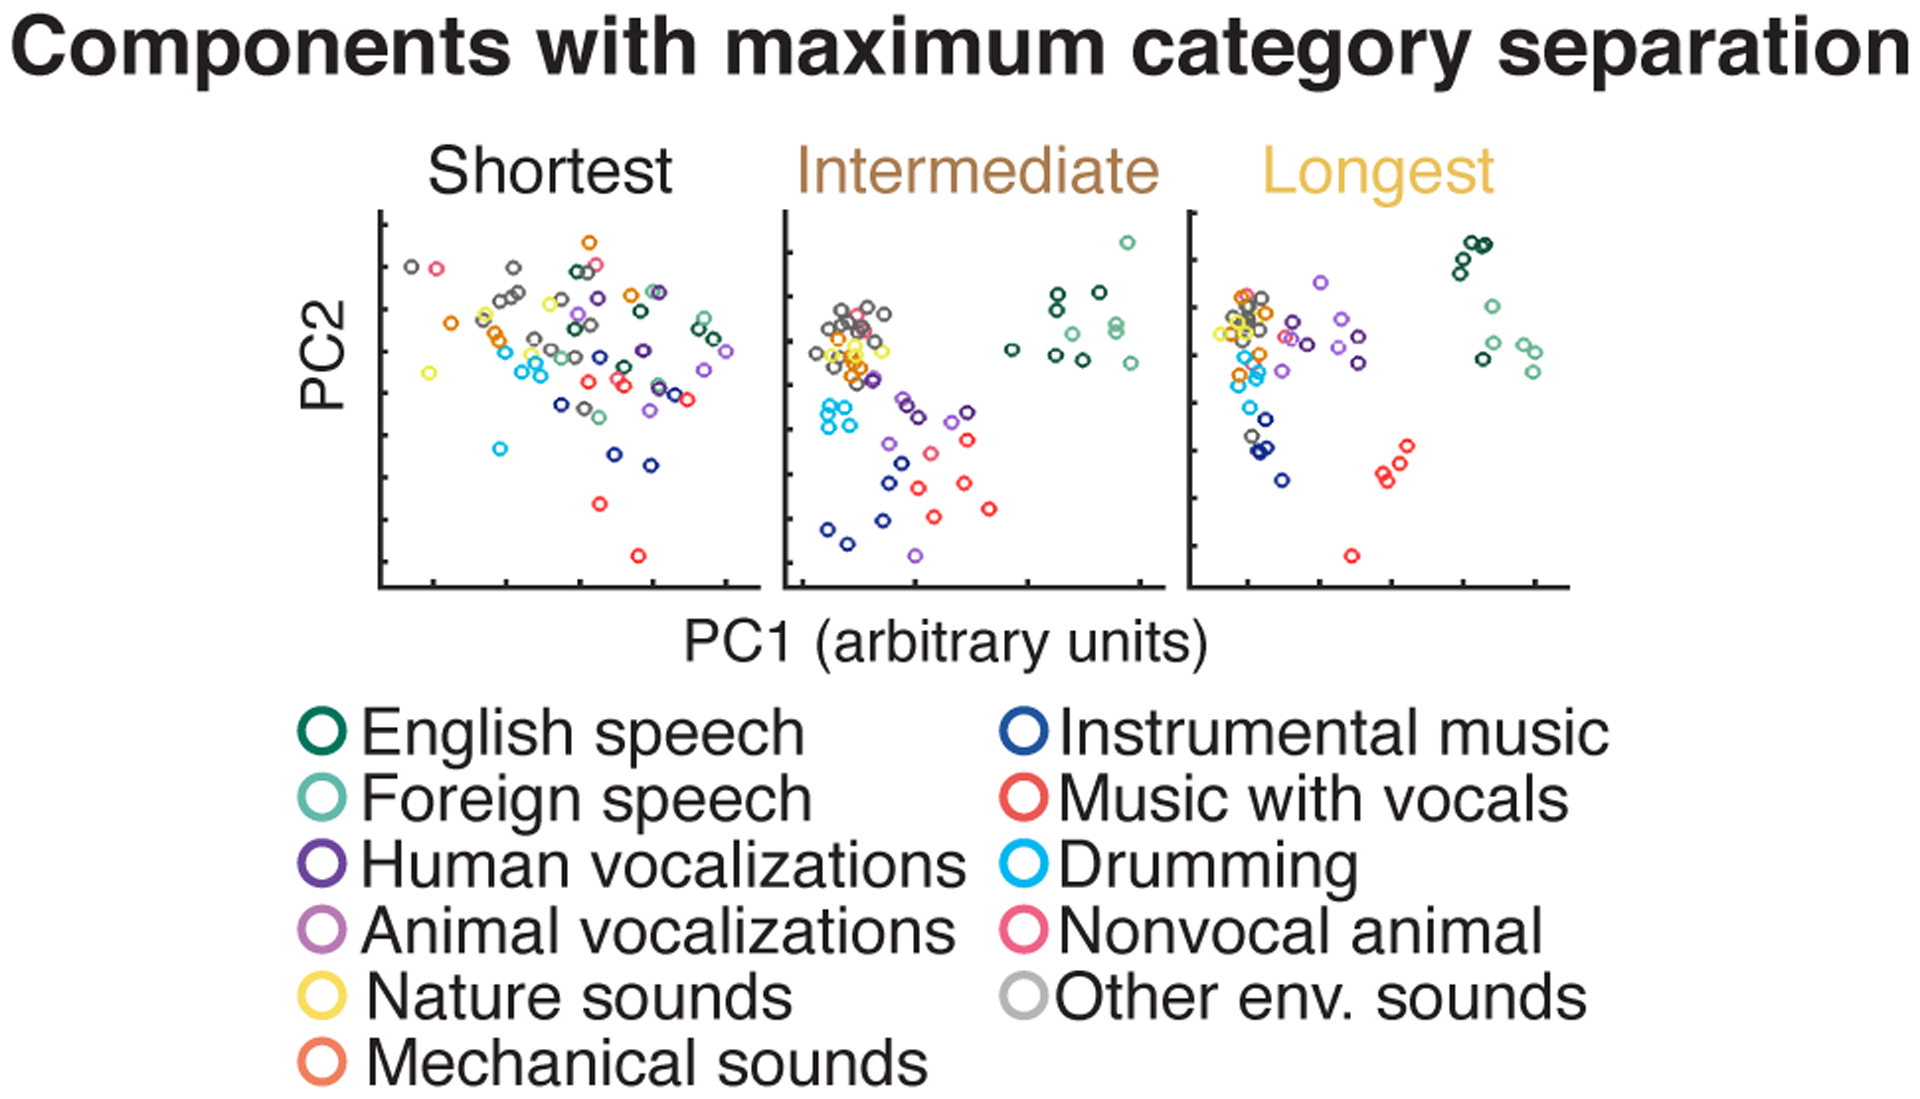
Extended Data Fig. 7. Components most selective for sound categories at different integration widths.

Electrodes were subdivided into three equally sized groups based on the width of their integration window. The time-averaged response of each electrode was then projected onto the top 2 components that showed the greatest category selectivity, measured using linear discriminant analysis (each circle corresponds to a unique sound). Same format as Figure 5b, which plots responses projected onto the top 2 principal components. Half of the sounds were used to compute the components, and the other half were used to measure their response to avoid statistical circularity. As a consequence, there are half as many sounds as in Figure 5b.
