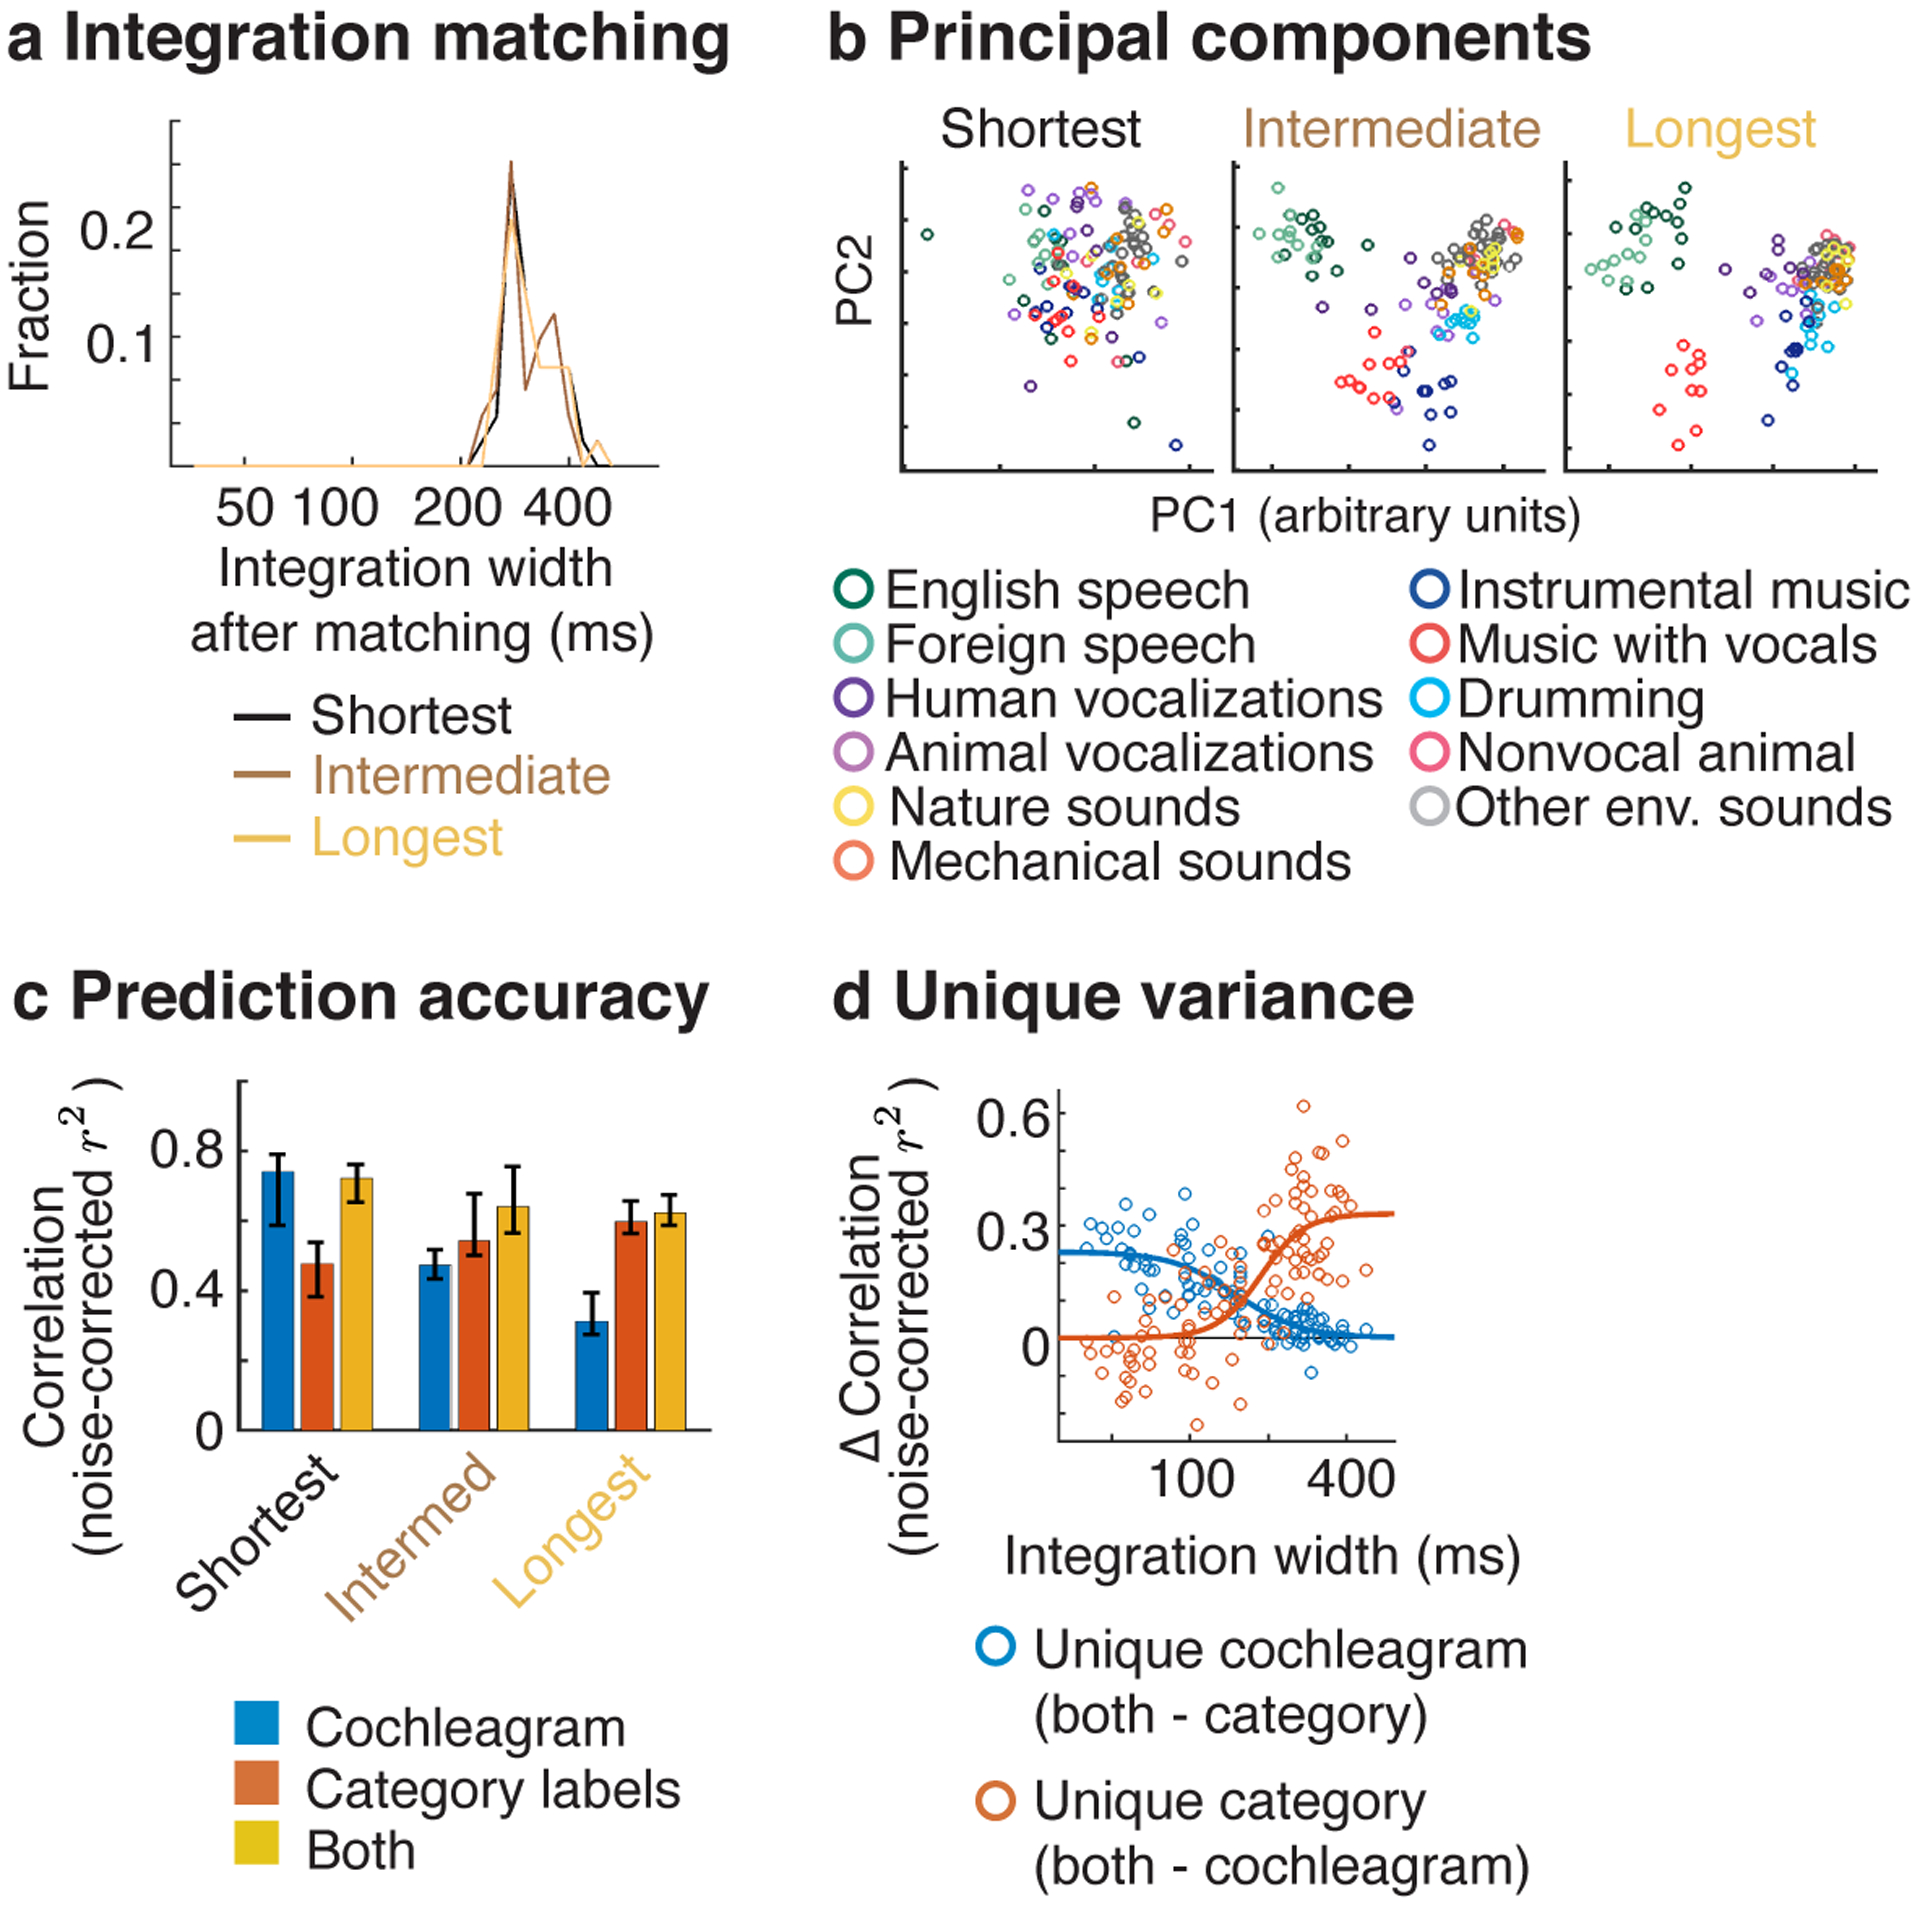
Extended Data Fig. 8. Results for integration-matched responses.

a, For our functional selectivity analyses, we subdivided the electrodes into three equally sized groups, based on the width of their integration window. To test if our results were an inevitable consequence of differences in temporal integration, we matched the integration windows across the electrodes in each group. Matching was performed by integrating the responses from the electrodes in the short and intermediate groups within an appropriately chosen window, such that the resulting integration window matched those for the longest group (see Integration matching in Methods). This figure plots a histogram of the effective integration windows after matching. b-d, These panels show the results of our applying our functional selectivity analyses to integration-matched responses. Format is the same as Figure 5b–d.
