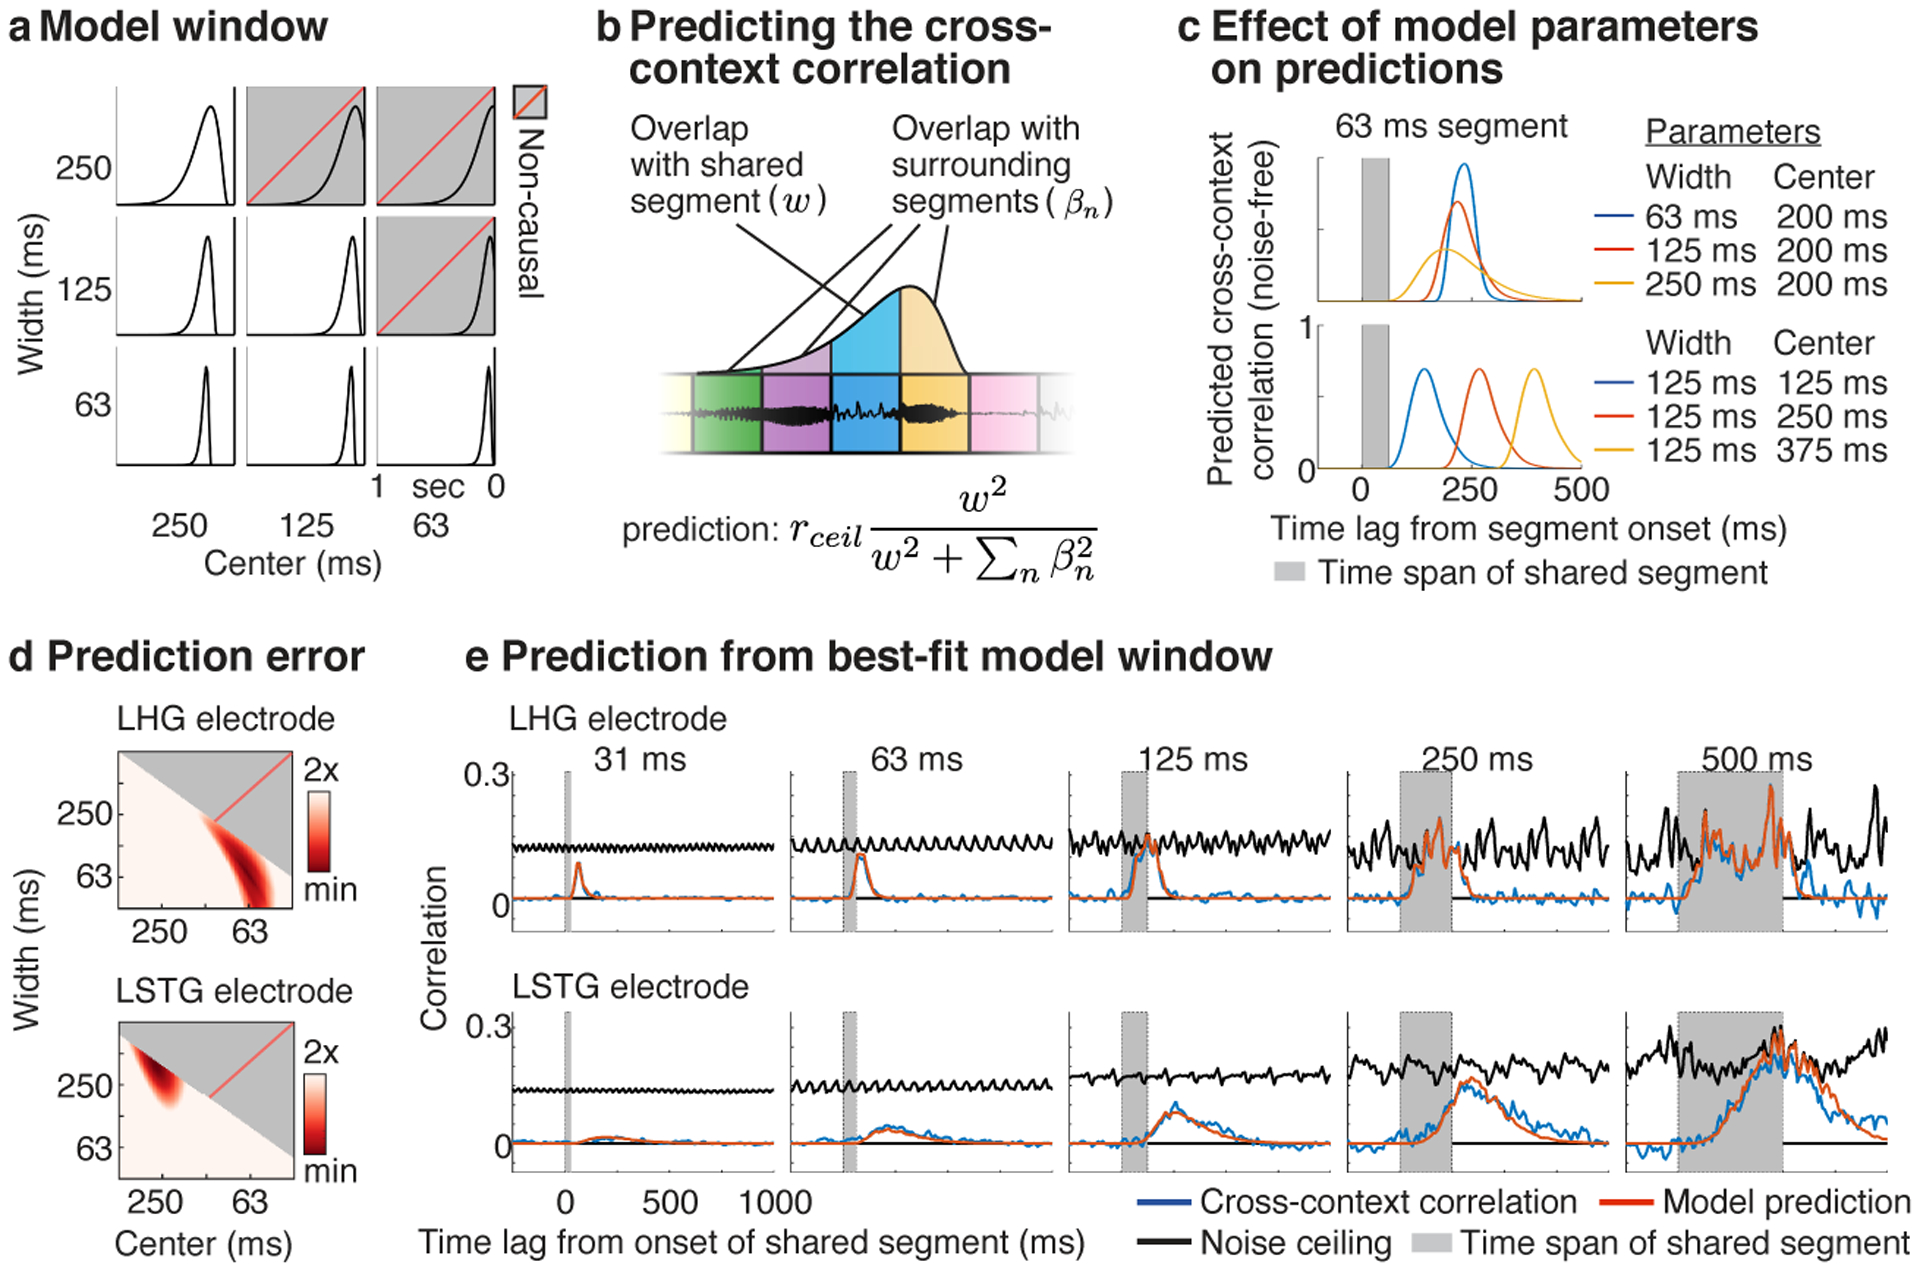
Fig 3. Model-estimated integration windows.

a, Temporal integration windows were modeled using a Gamma distribution. The width and center of the model window were varied, excluding combinations of widths and centers that resulted in a non-causal window (indicated by gray boxes with dashed red line). b, Schematic showing the procedure used to predict the cross-context correlation. For a given lag and segment duration, we measured how much the window overlapped the shared central segment (w, blue segment) vs. all surrounding context segments (βn, yellow, purple, and green segments). The cross-context correlation should reflect the fraction of the response variance due to the shared segment, multiplied by the noise ceiling (rceil). The variance due to each segment is given by the squared overlap with the model window. The overlap measures (w, βn) varied as a function of lag and segment duration and were computed by convolving the model window with boxcar functions representing each segment (tapered at the boundaries to account for cross-fading). c, Illustration of how the width (top panel) and center (bottom panel) of the window alter the model’s prediction for a single segment duration (63 milliseconds). Increasing the width lowers and stretches-out the predicted cross-context correlation, while increasing the center shifts the cross-context correlation to later lags. d, The prediction error for model windows of varying widths and centers for the example electrodes from Figure 2b. Redder colors indicate lower error. e, The measured and predicted cross-context correlation for the best-fit window with lowest error (same format as Fig 2b).
