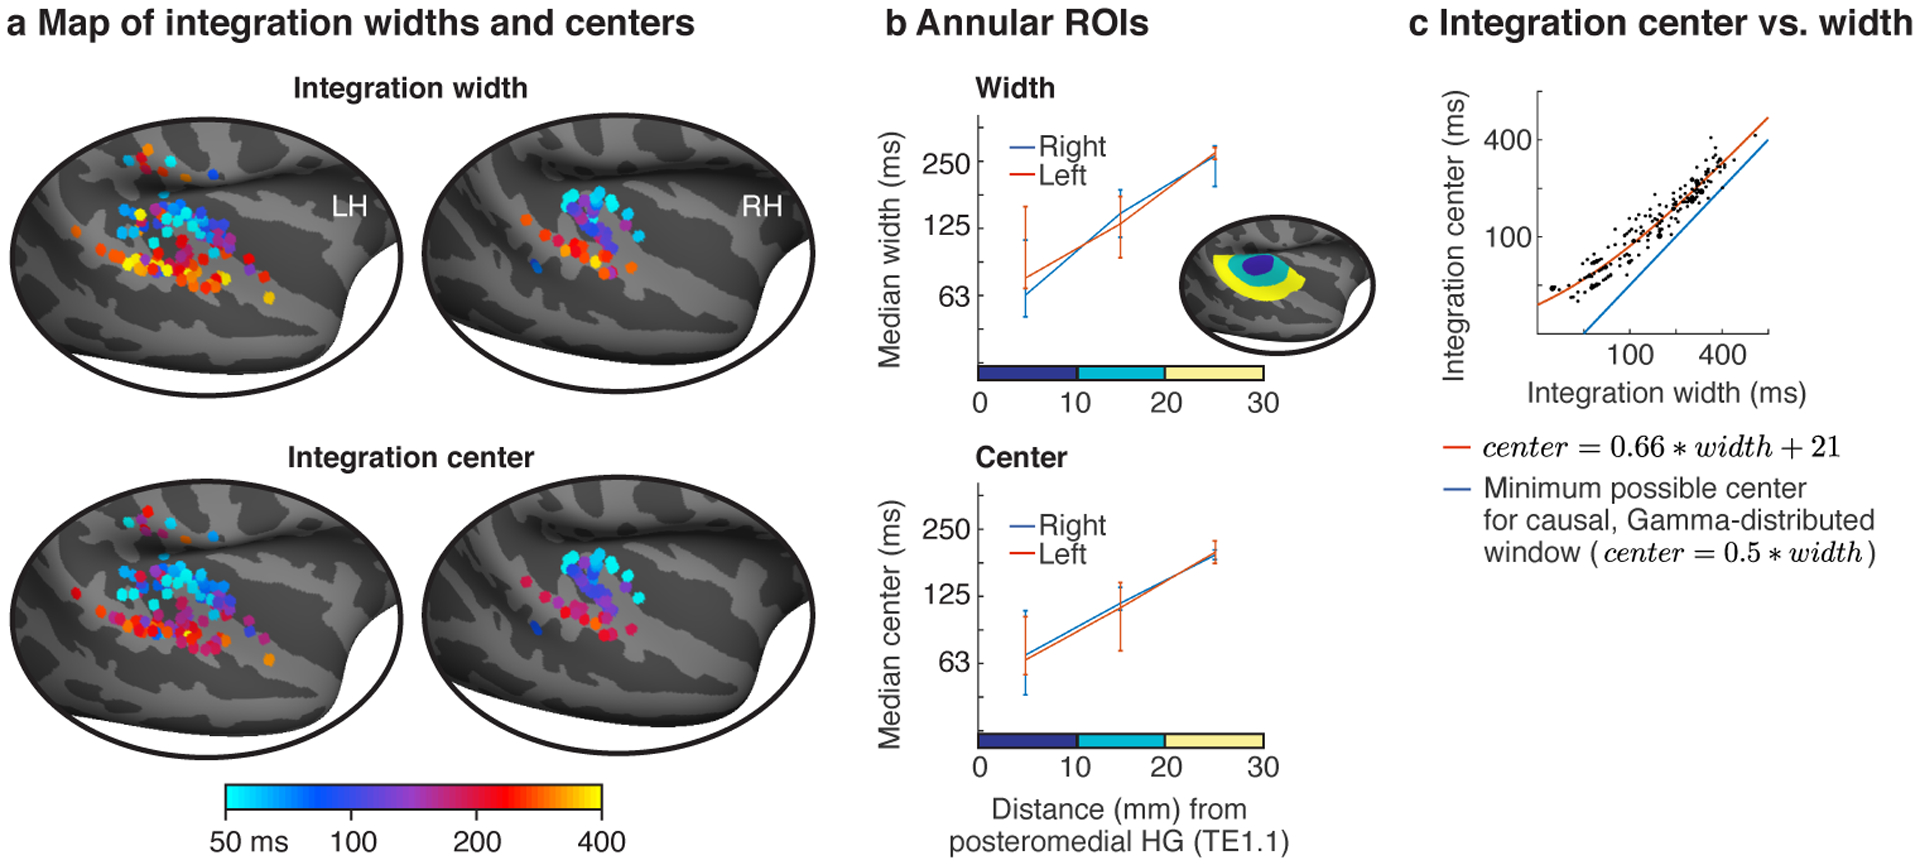
Fig 4. Anatomy of model-estimated integration windows.

a, Map of integration widths (top) and centers (bottom) for all electrodes with a reliable response to sound. b, Electrodes were binned into ROIs based on their distance to a common anatomical landmark of primary auditory cortex (posteromedial Heschl’s gyrus, TE1.1). This figure plots the median integration width and center across the electrodes in each bin. Inset shows the ROIs for one hemisphere. Error bars plot one standard error of the bootstrapped sampling distribution across subjects and electrodes. c, Scatter plot of integration centers vs. widths for all electrodes. The integration width places a lower bound on the integration center for a causal window (blue line). Integration centers scaled approximately linearly with the integration width and remained relatively close to the minimum possible for a causal window. The orange line shows the affine function that best fit the data (equation shown). The line appears curved because the axes are logarithmically scaled. Each dot corresponds to an electrode and larger dots indicate that multiple electrodes were assigned to that pairing of centers/widths.
