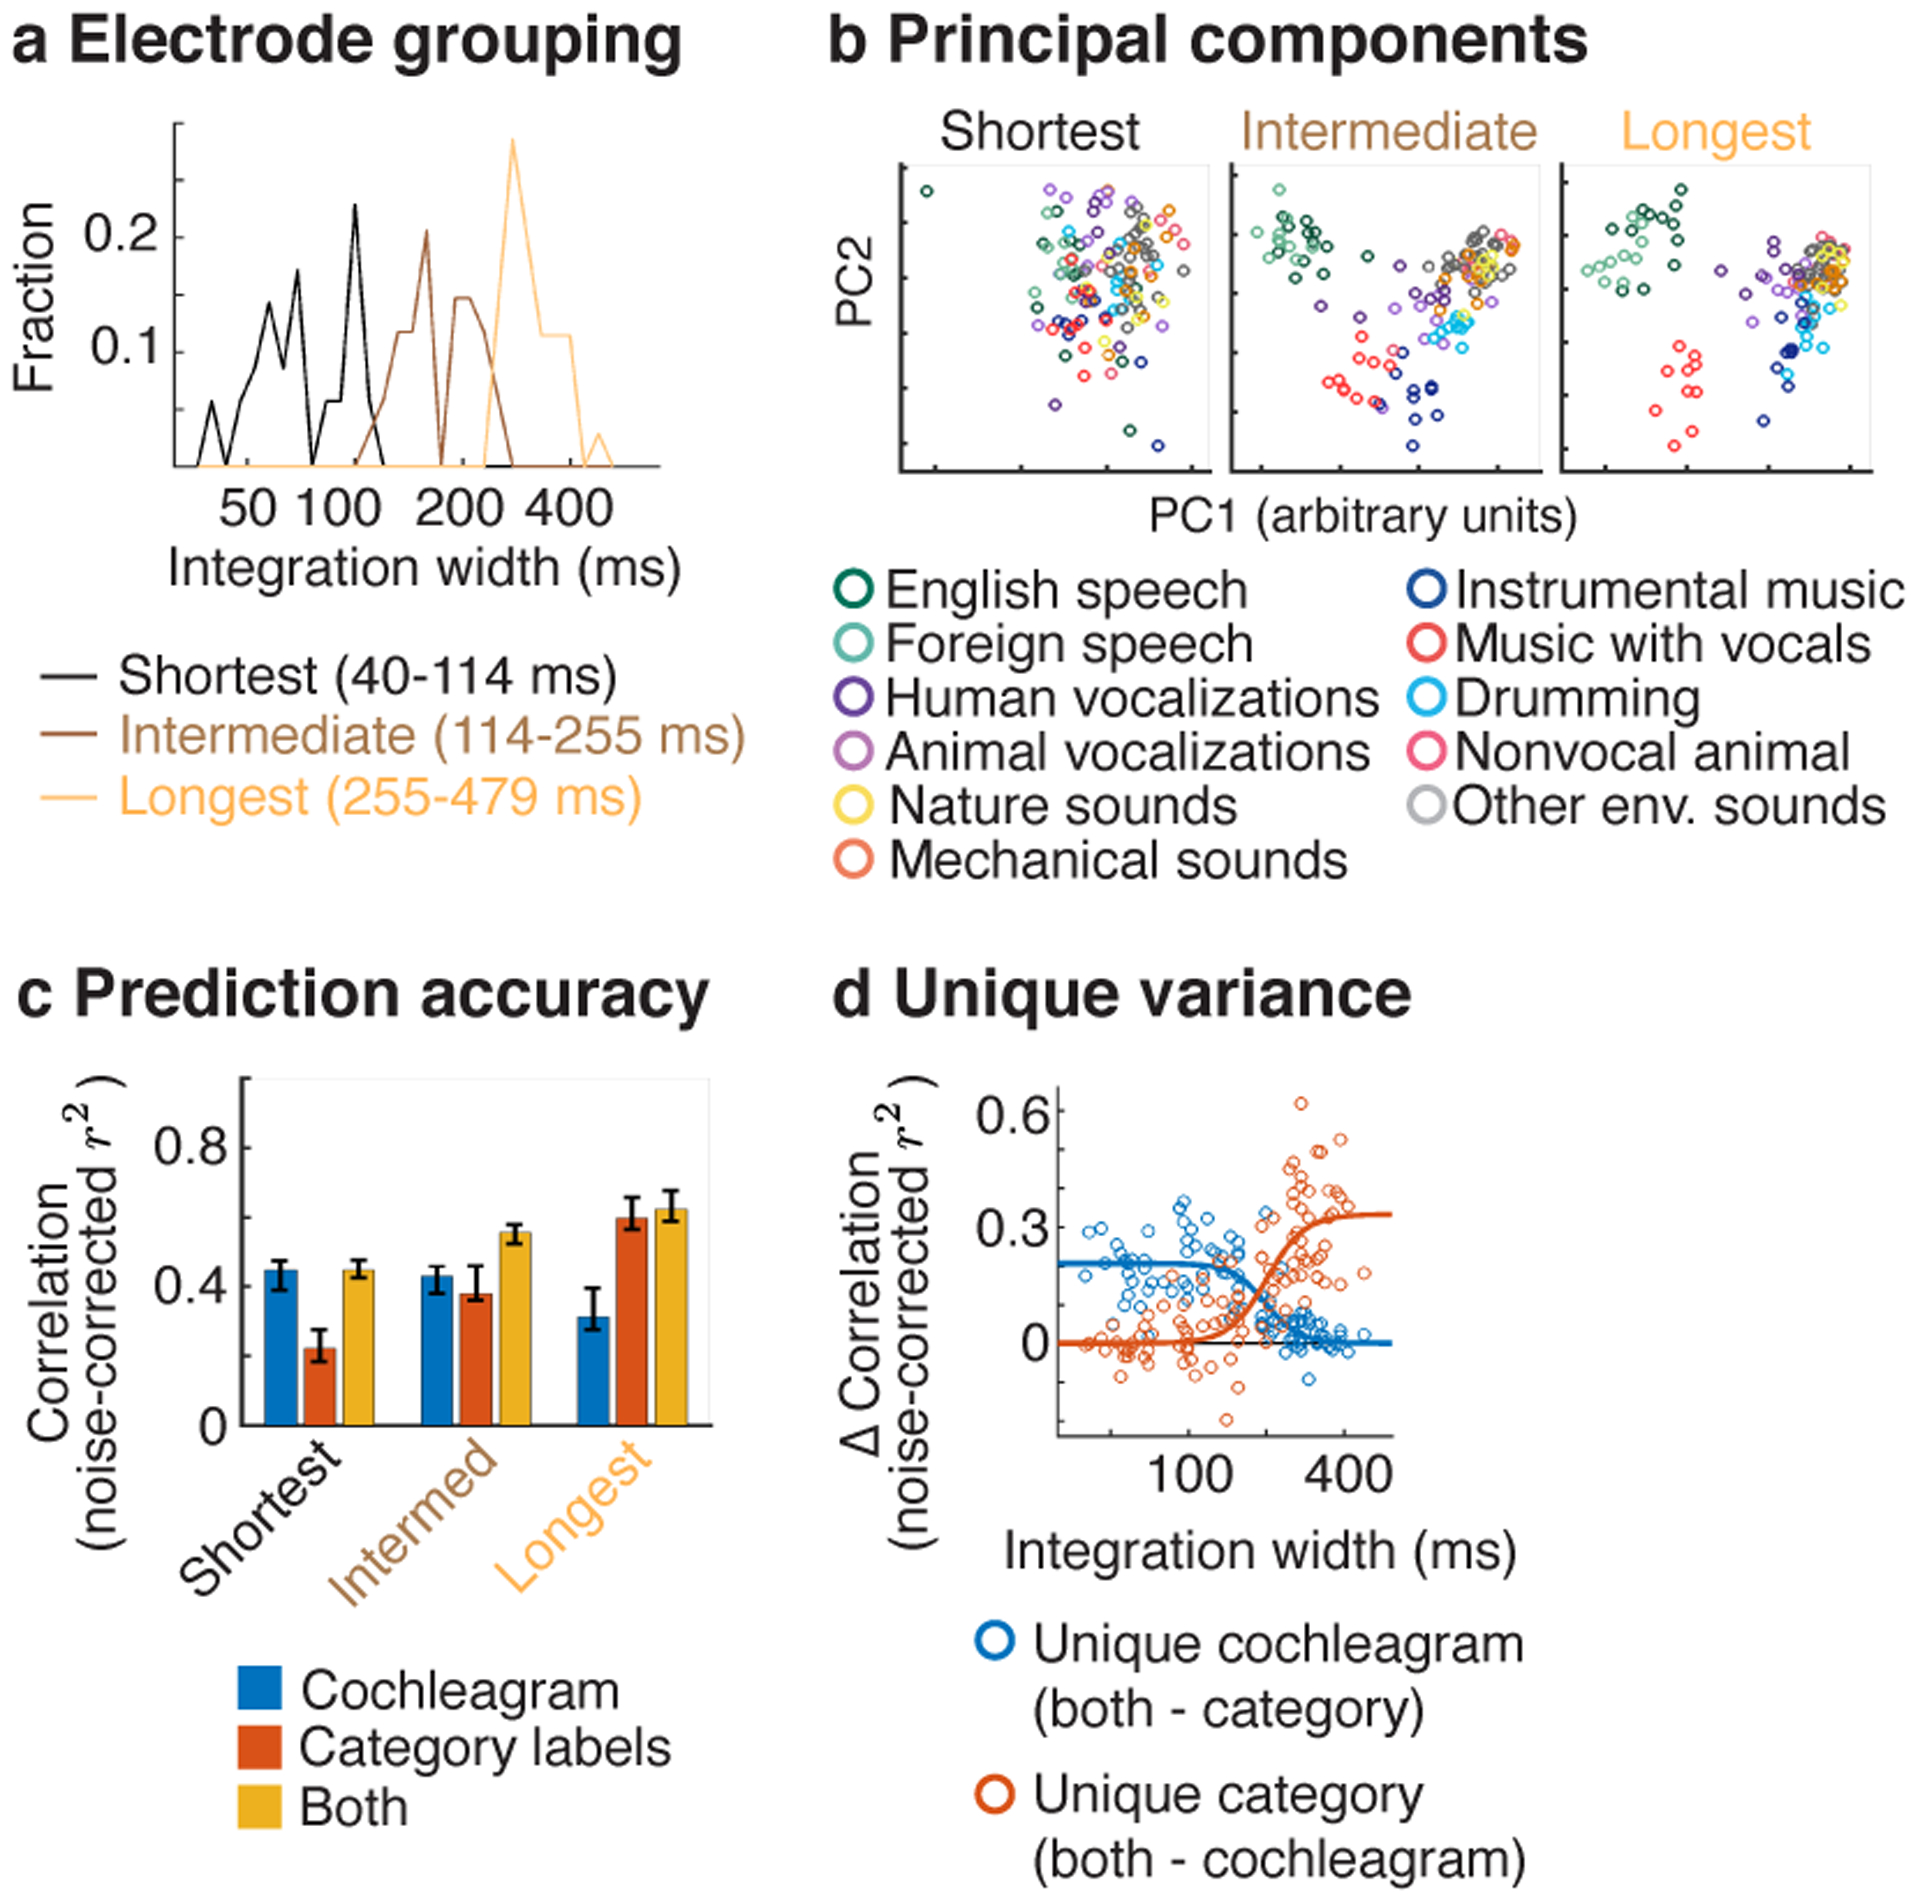
Fig 5. Functional selectivity in electrodes with differing integration windows.

Responses were measured in a subset of patients to a larger collection of 119 natural sounds (4-seconds in duration) from 11 sound categories, listed in panel b. a, Electrodes from these patients were subdivided into three equally sized groups based on the width of their integration window. b, This panel plots the time-averaged response of the electrodes across all 119 sounds, projected onto the top 2 principal components from each group. The population response to sounds from different categories becomes increasingly segregated as integration windows increase. c, The accuracy of cochleagrams (blue line), category labels (red line), and both cochleagrams and categories in predicting electrode response timecourses. This panel plots the median squared correlation for each feature set (noise-corrected) across the electrodes in each group. d, This panel plots the difference in prediction accuracy between the combined model and the individual models (i.e. just cochleagrams or just category labels), which provides a measure of the unique variance explained by each feature type. Each circle corresponds to a single electrode (N=104). A logistic curve has been fit to the distribution of prediction accuracies for each feature set.
