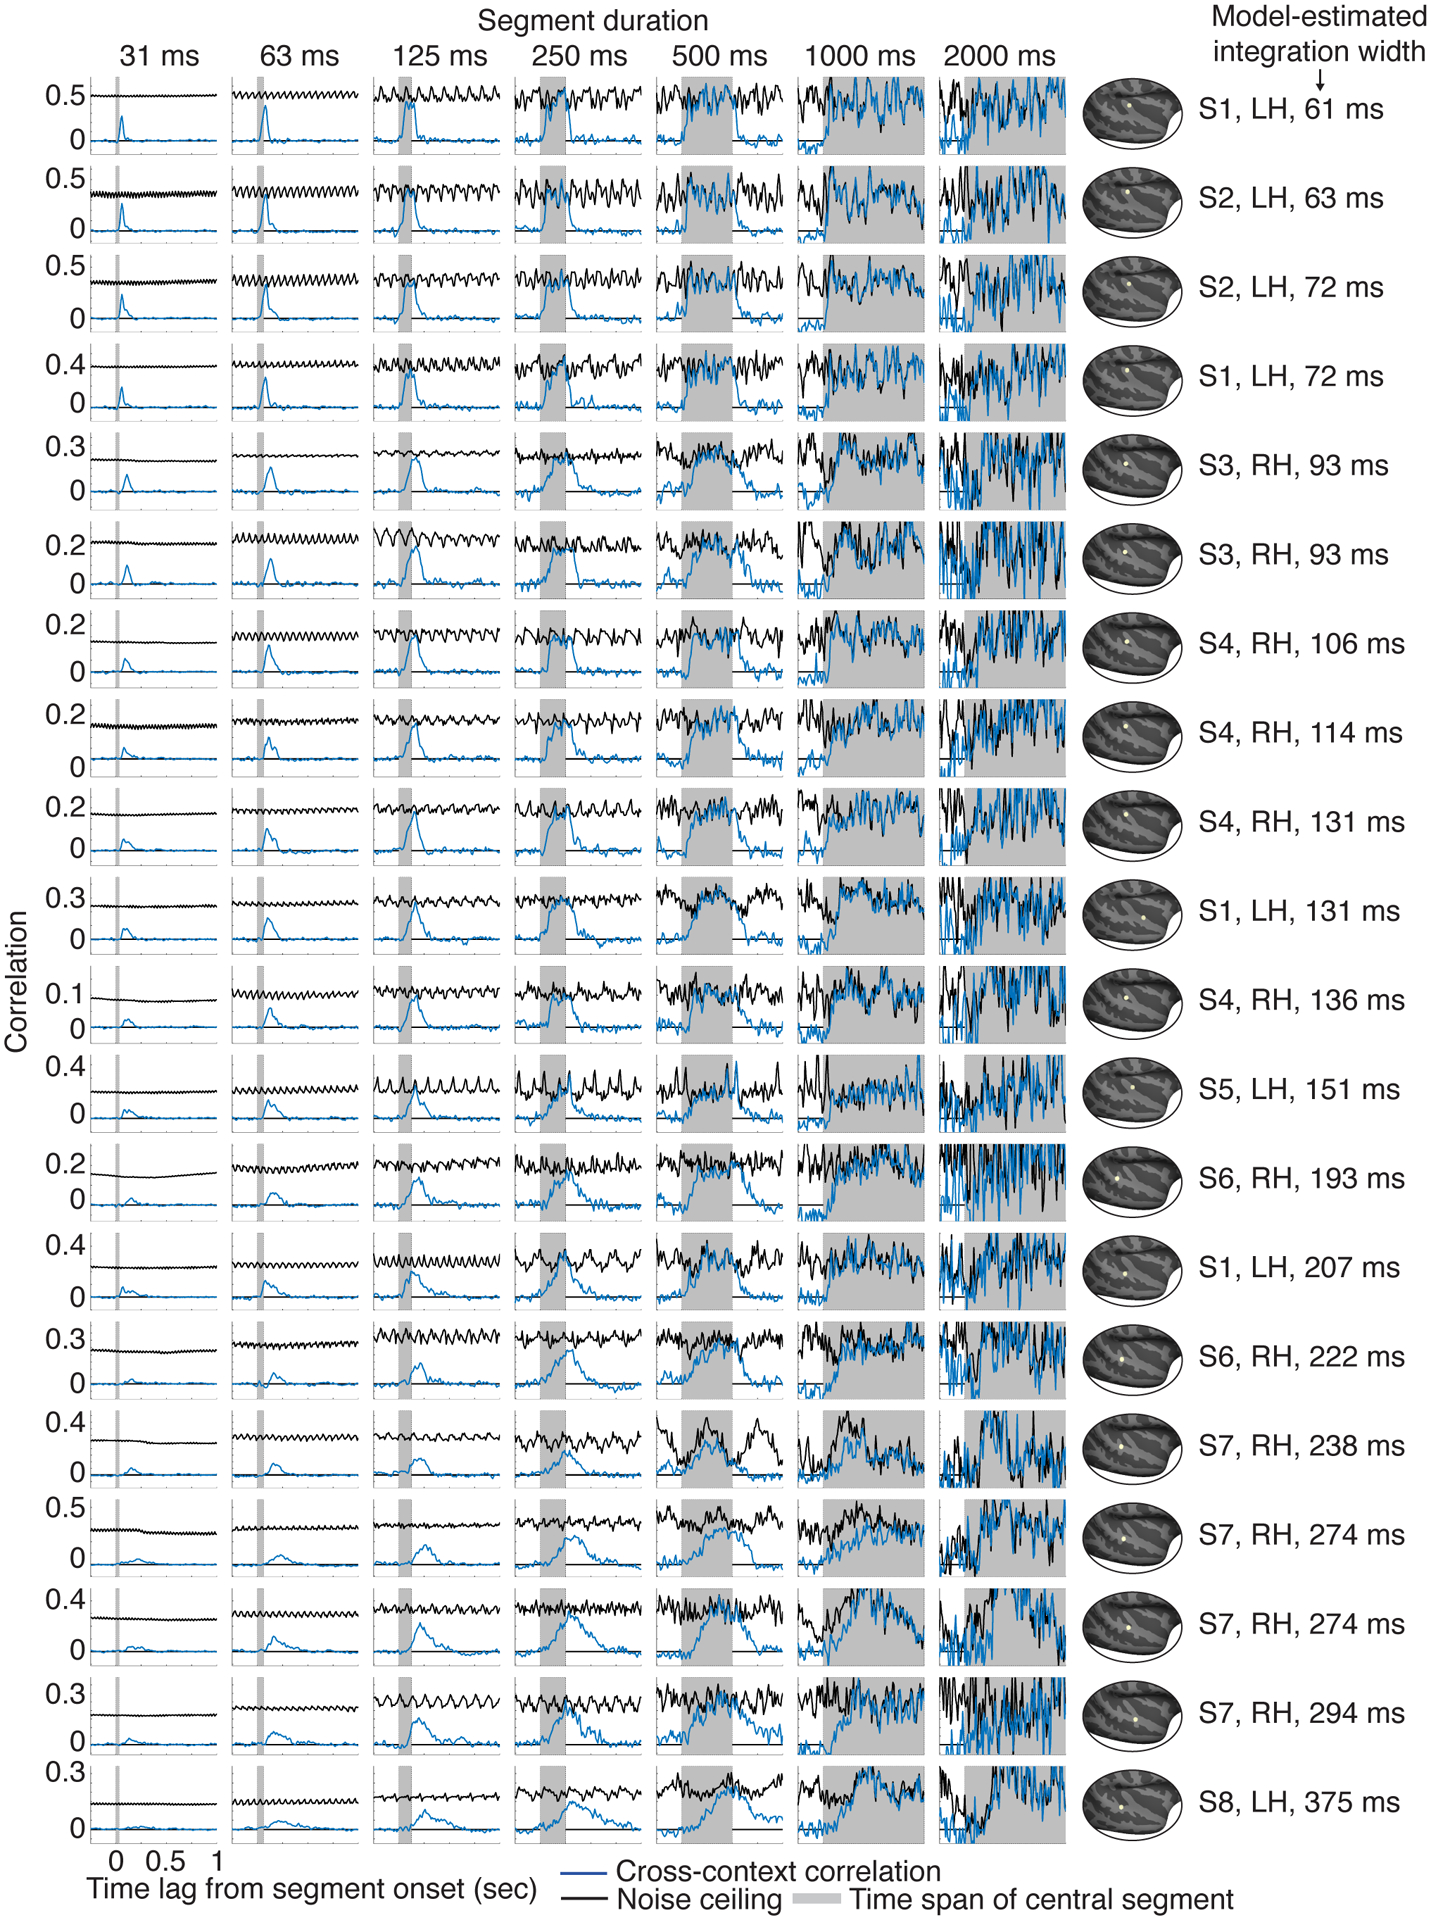
Extended Data Fig. 2. Cross-context correlation for 20 representative electrodes.

Electrodes were selected to illustrate the diversity of integration windows. Specifically, we partitioned all sound-responsive electrodes into 5 groups based on the width of their integration window, estimated using a model (Fig 3 illustrates the model). For each group, we plot the four electrodes with the highest SNR (as measured by the test-retest correlation across the sound set). Electrodes have been sorted by their integration width, which is indicated to the right of each plot, along with the location, hemisphere and subject number for each electrode. Each plot shows the cross-context correlation and noise ceiling for a single electrode and segment duration (indicated above each column). There were more segments for the shorter durations, and as a consequence, the cross-context correlation and noise ceiling were more stable/reliable for shorter segments (the number of segments is inversely proportional to the duration). This property is useful because at the short segment durations, there are a smaller number of relevant time lags, and it is useful if those lags are more reliable. The model used to estimate integration windows pooled across all lags and segment durations, taking into account the reliability of each datapoint.
