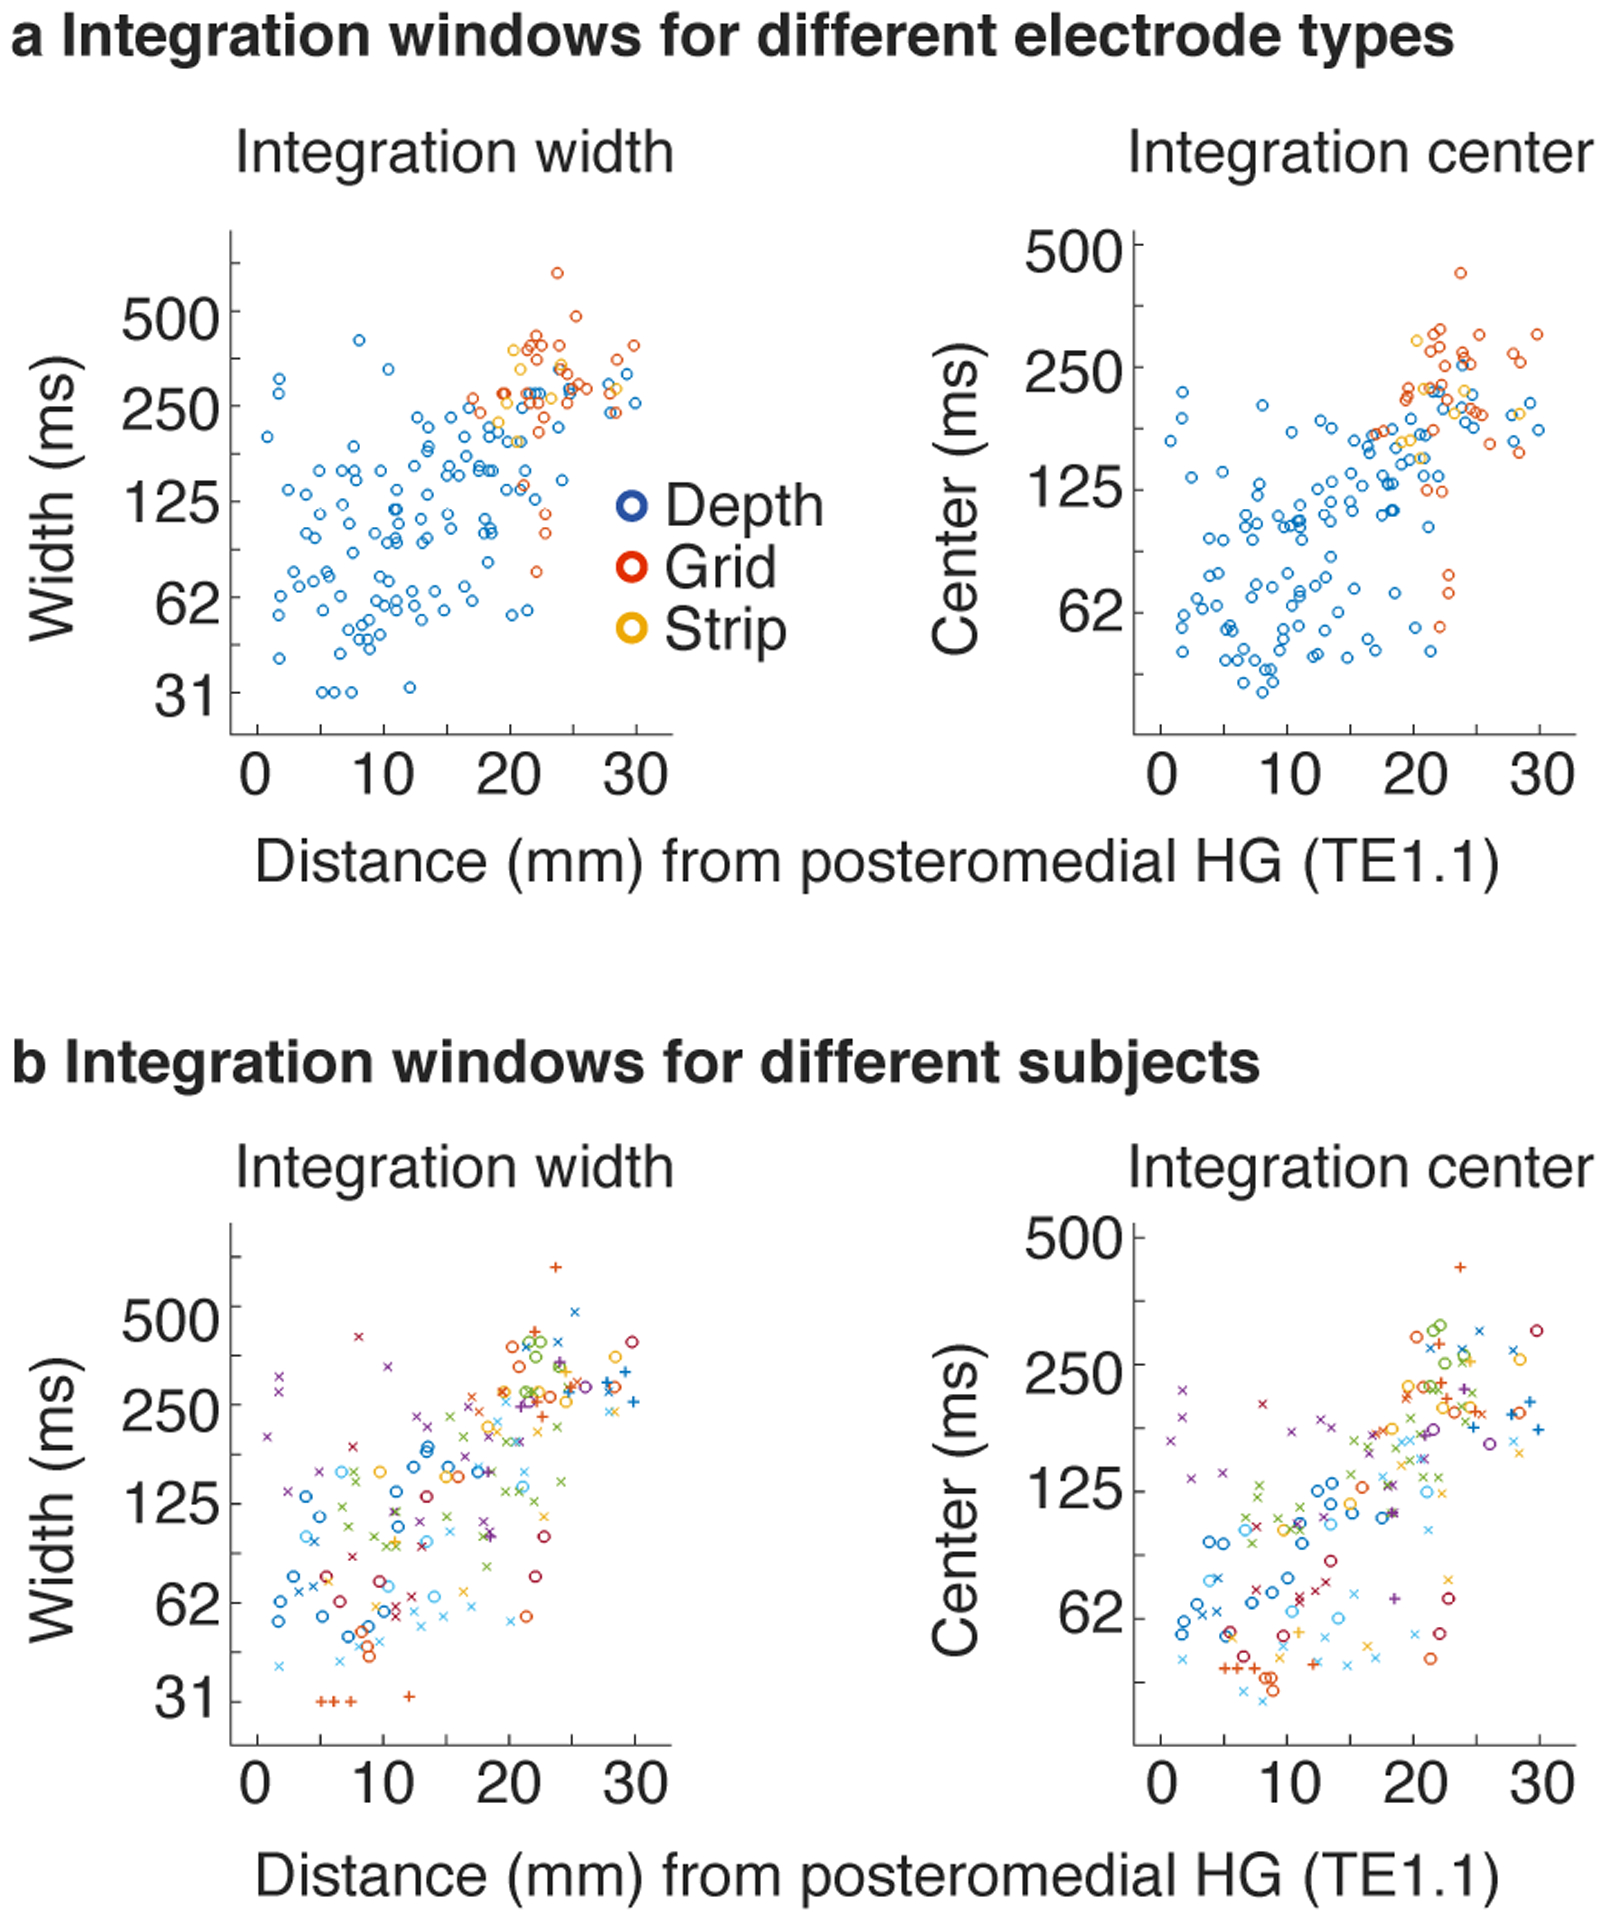
Extended Data Fig. 4. Integration windows for different electrode types and subjects.

a, This panel plots integration widths (left) and centers (right) for individual electrodes as a function of distance to primary auditory cortex, defined as posteromedial Heschl’s gyrus. The electrodes have been labeled by their type (grid, depth, strip). The grid/strip electrodes were located further from primary auditory cortex on average, but given their location did not show any obvious difference in integration properties. The effect of distance was significant for the depth electrodes alone (the most numerous type of electrode) when excluding grids and strips (width: F1,14.53 = 24.51, p < 0.001, βdistance = 0.065 octaves/mm, CI = [0.039, 0.090]; center: F1,12.83 = 27.76, p < 0.001, βdistance = 0.052 octaves/mm, CI = [0.032, 0.071], N=114 electrodes). To be conservative, electrode type was included as a covariate in the linear mixed effects model used to assess significance as a whole. b, Same as panel a but indicating subject membership instead of electrode type. Each symbol corresponds to a unique subject. The effect of distance on integration windows is broadly distributed across the 18 subjects.
