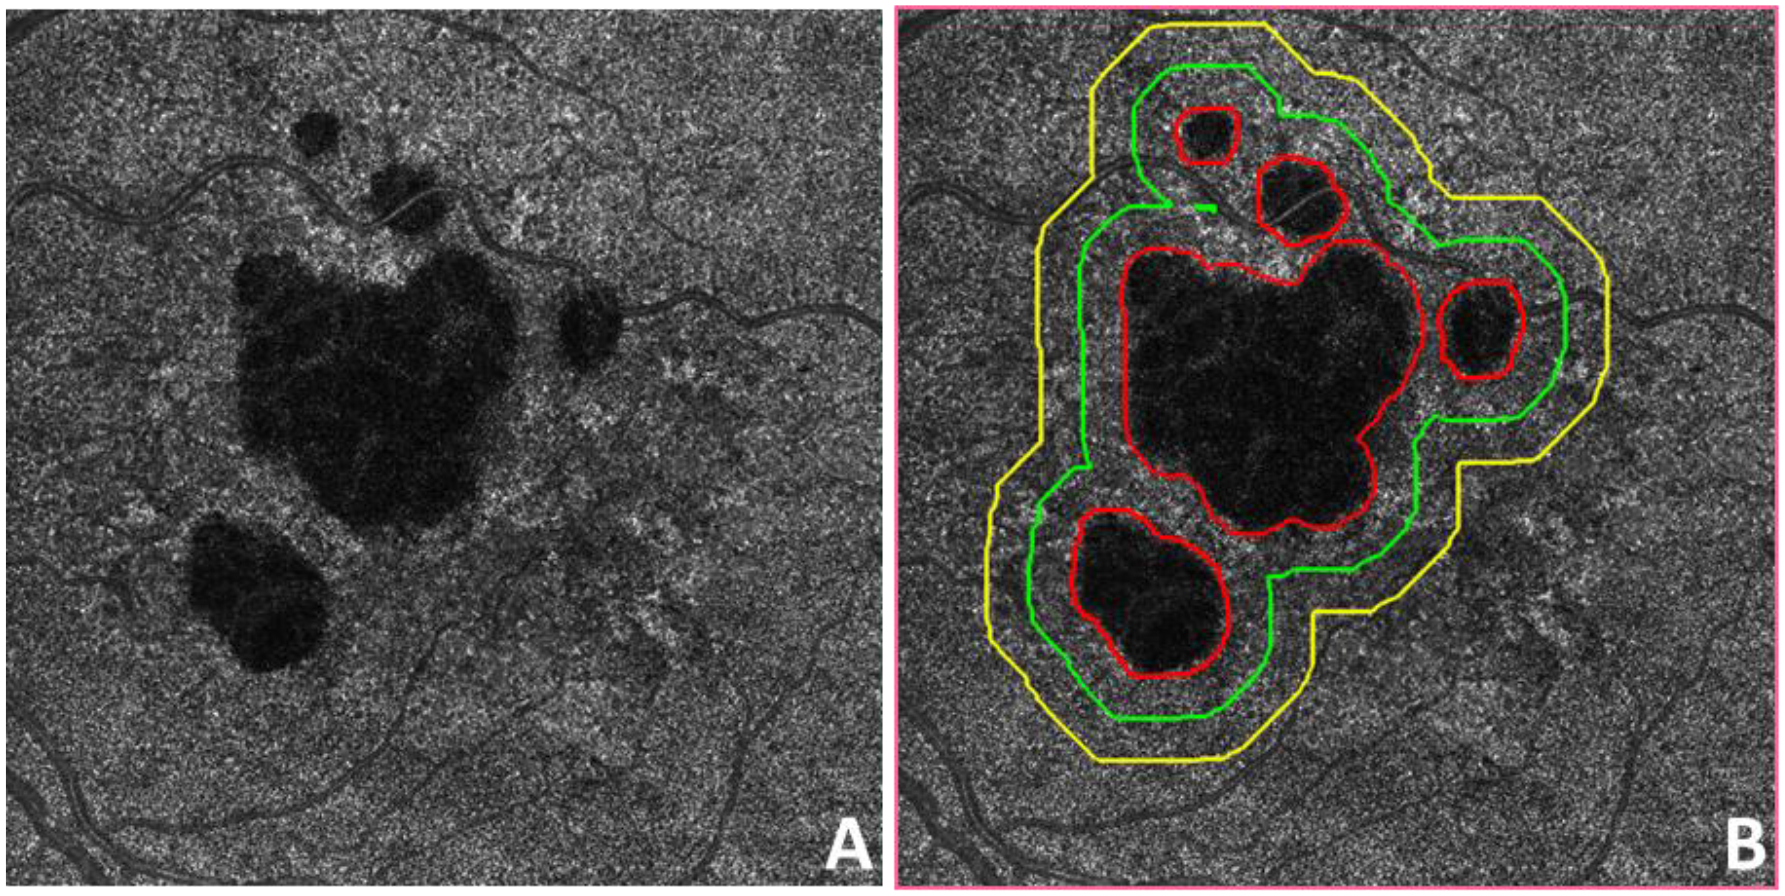
Figure 3:

Example of regions analyzed around geographic atrophy (GA). A: Swept source OCT (SS-OCT) optical attenuation coefficient (OAC) max en face image of a subject diagnosed with GA. B: The same OAC max image as in panel A with red lines depicting manually graded area of GA. Green line represents a 300 μm wide (1-degree) region outside the GA boundary. Yellow line represents a 600 μm wide (2-degree) region outside the GA boundary. The distance between the green and yellow lines is 300 μm.
