
Figure 4:
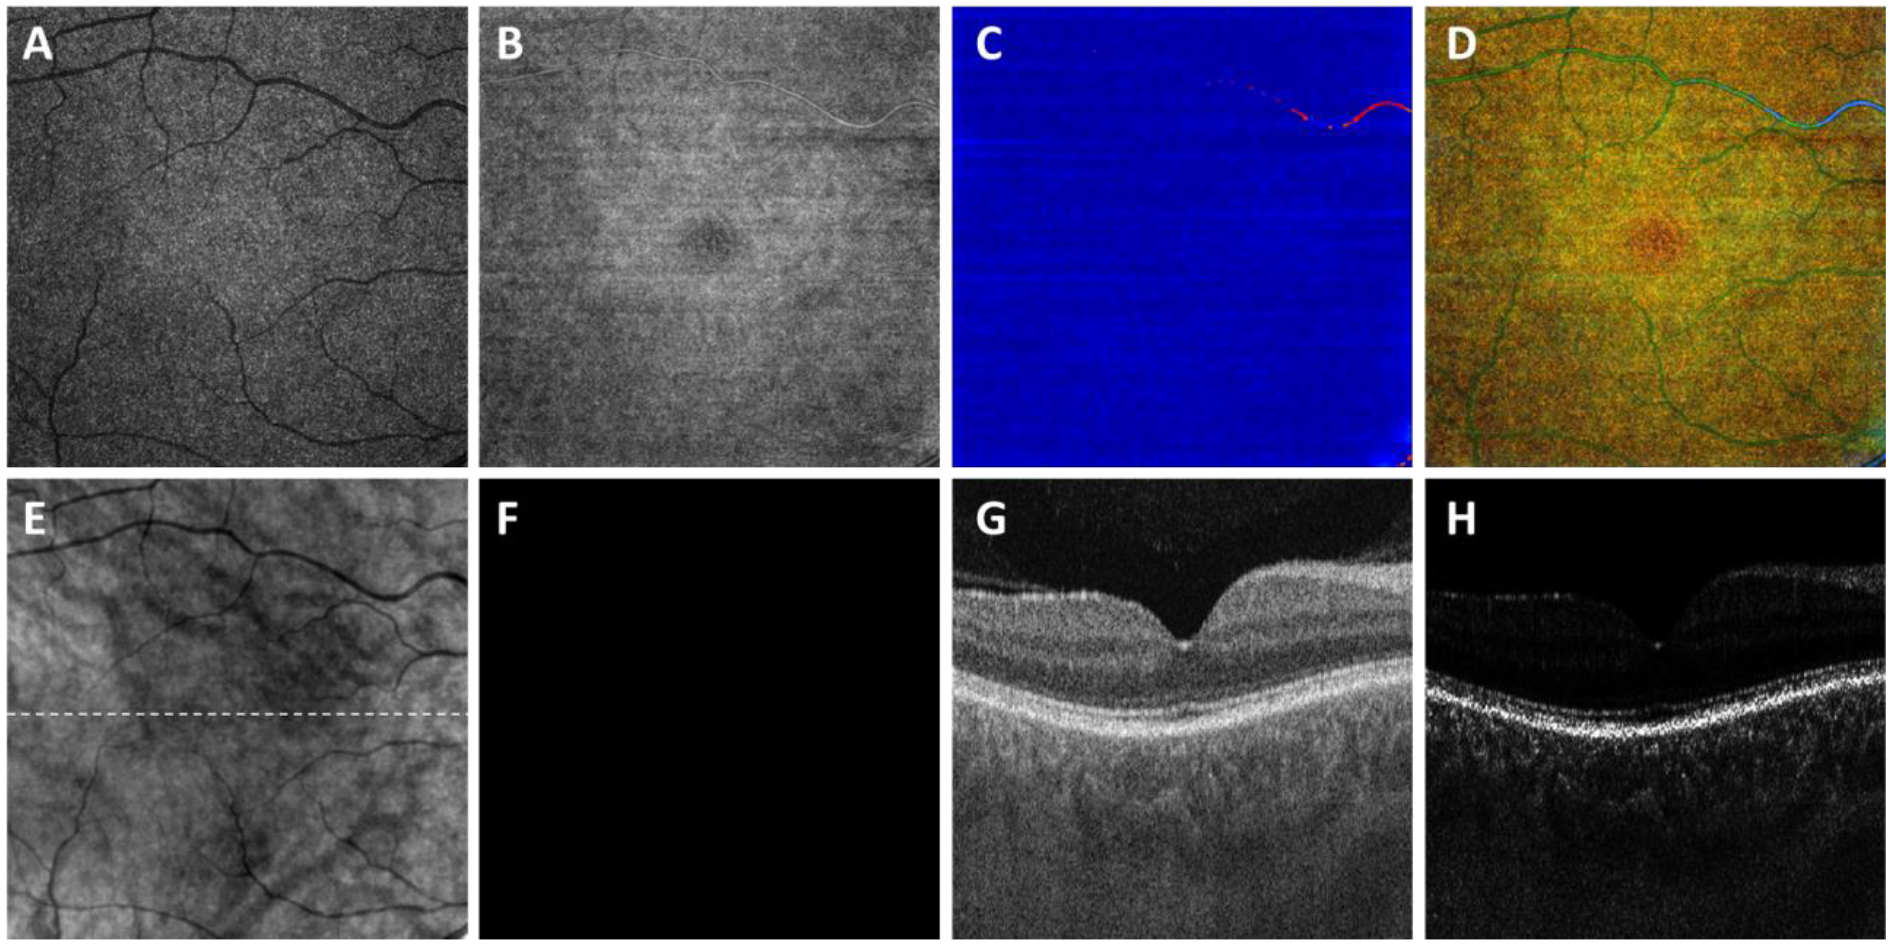
Visualization of a normal eye using the optical attenuation coefficient (OAC) estimated from swept source optical coherence tomography (SS-OCT) scans in a subject without ocular pathology. A: OAC max image. B: OAC sum image. C: OAC elevation map. D: OAC false color image. E: OCT subRPE image. F: Ground truth of GA generated by professional graders. G: OCT B-scan from the same subject, with the location represented in white dashed line in panel B. H: OAC B-scan from the same subject, with the same location as panel G. All images are from a 6×6 mm SS-OCT scan.