
Figure 7:
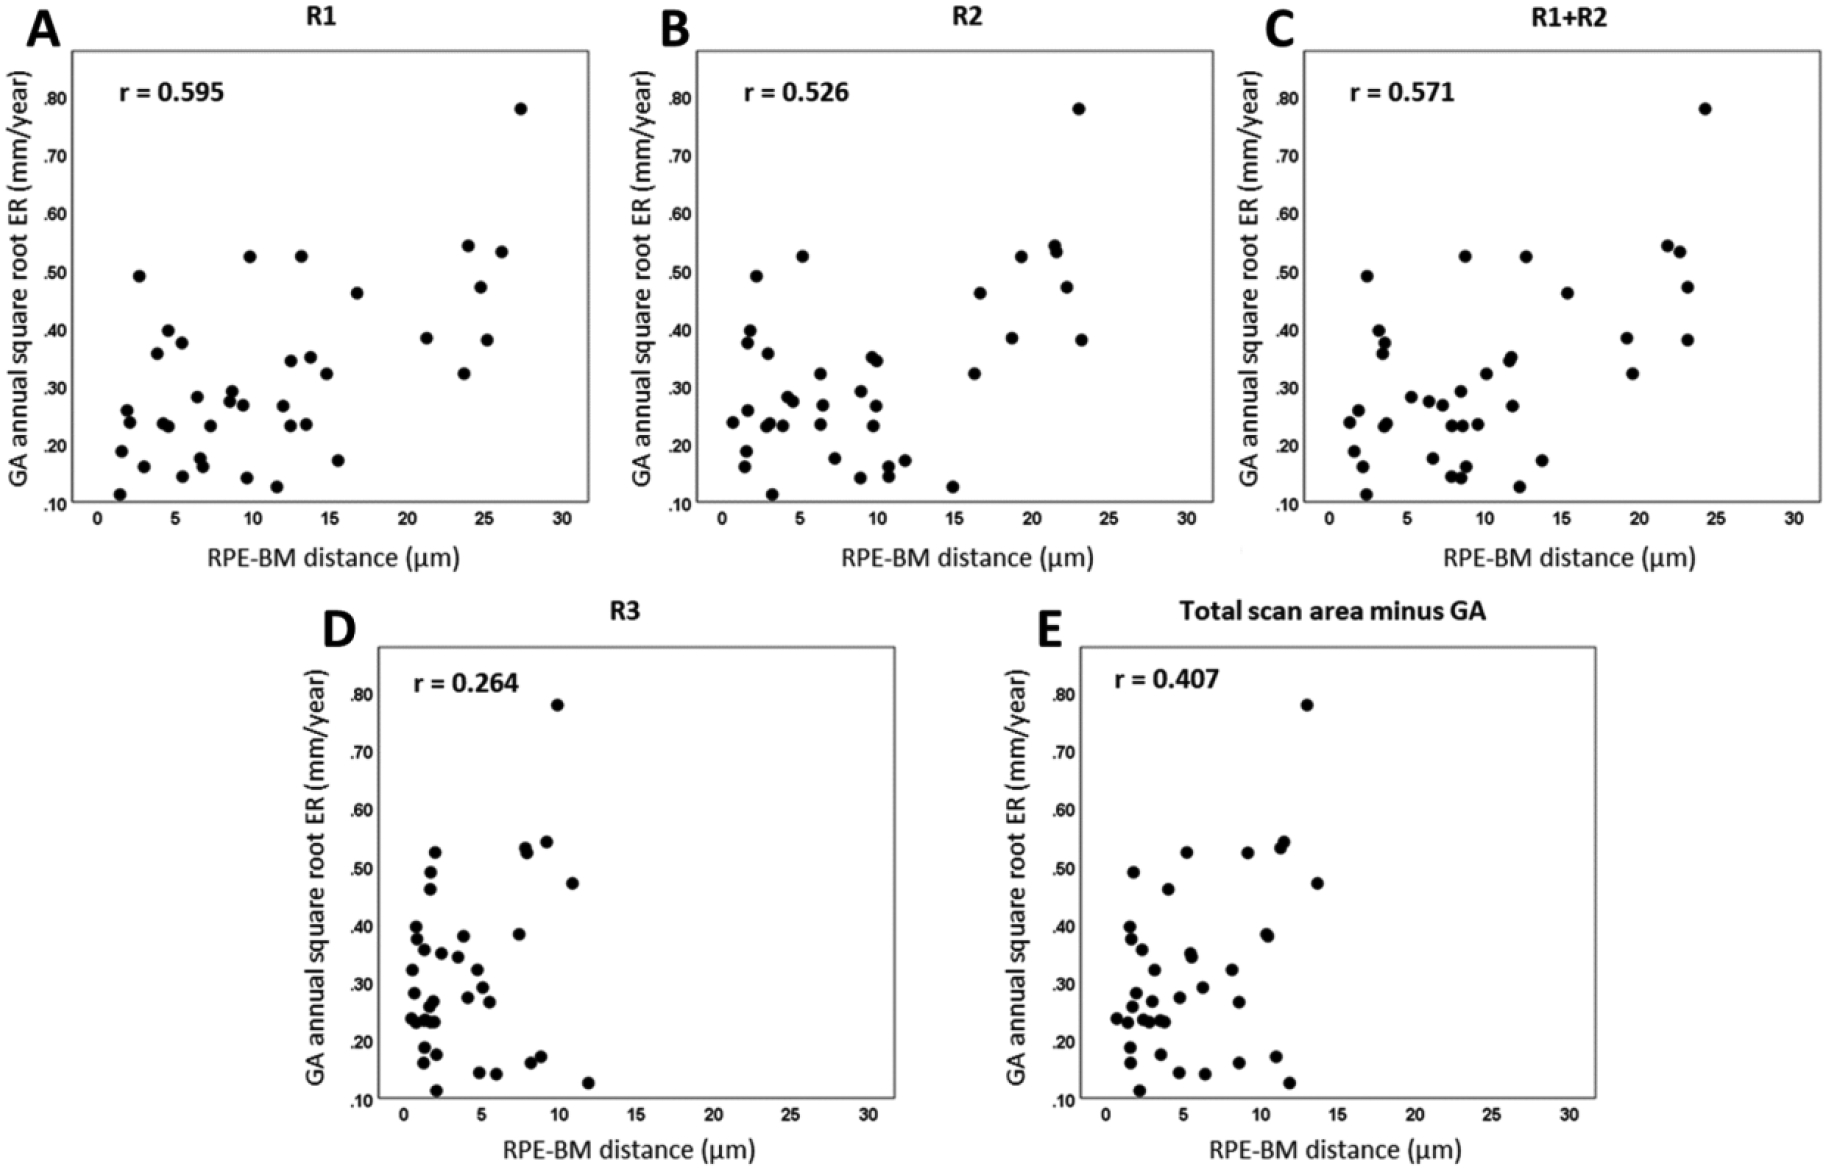
Scatter plots showing correlations between retinal pigment epithelium-Bruch’s membrane (RPE-BM) distance at baseline and the annual square root enlargement rates (ERs) of geographic atrophy (GA) in different regions: R1 (A), R2 (B), R1+R2 (C), R3 (D) and total scan area minus GA (E).