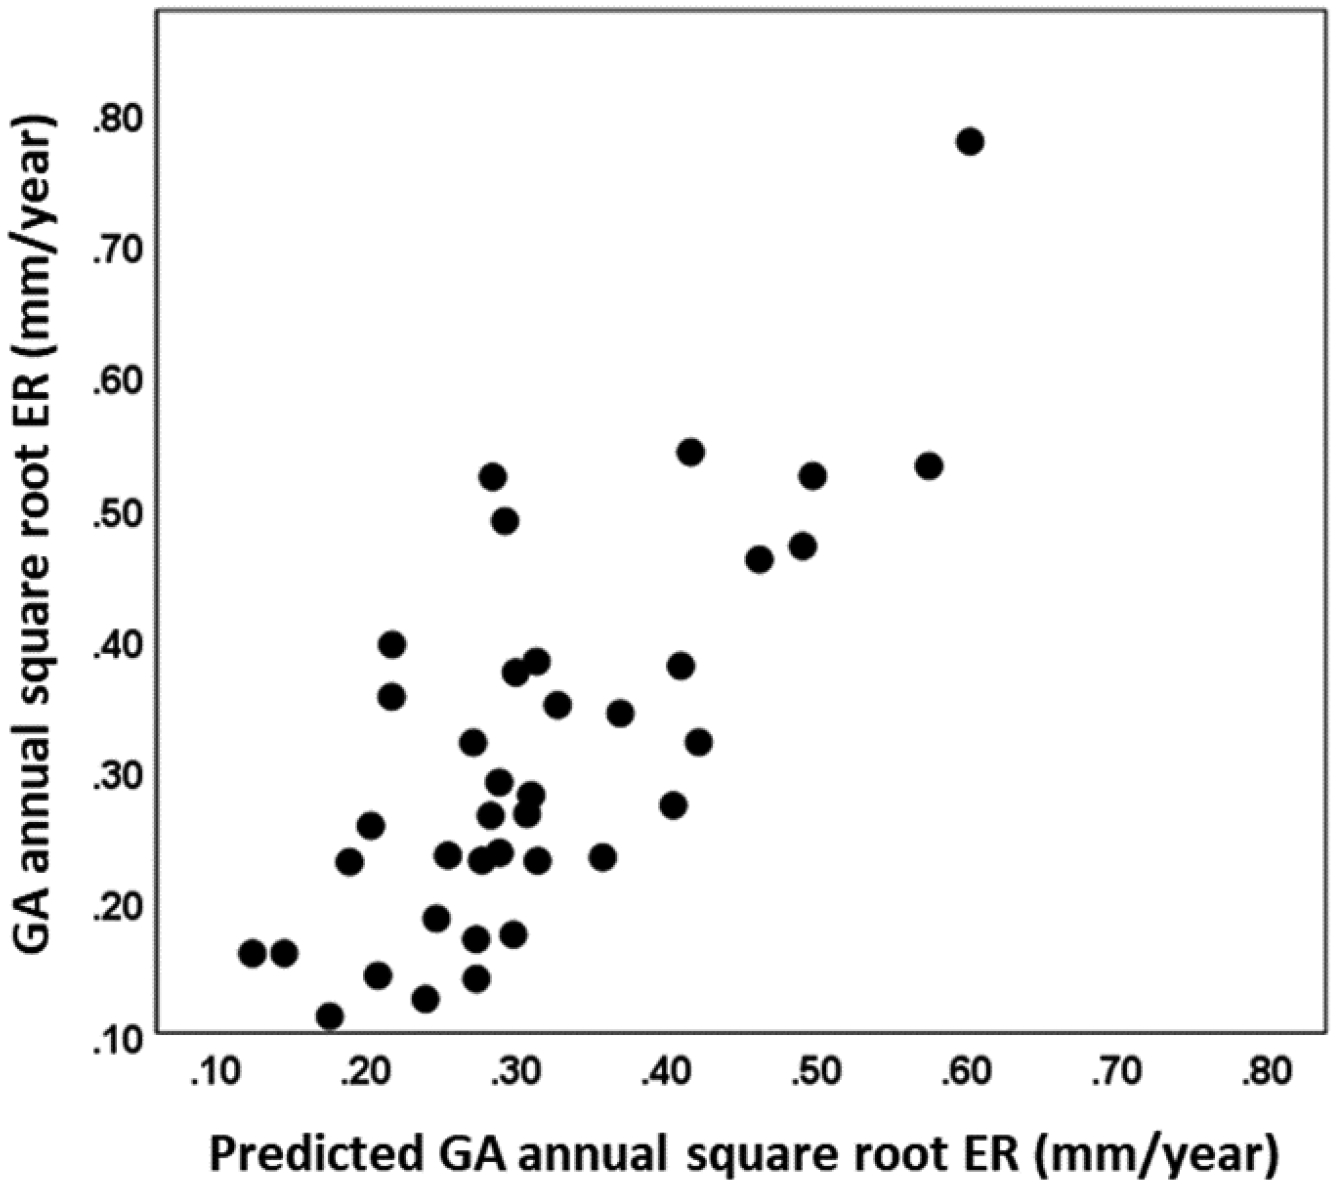
Figure 9:

Scatter plot of measured geographic atrophy (GA) annual square root enlargement rate (ER) against predicted GA annual square root ER for all 38 eyes. Predicted GA annual square root ER was generated using a multiple regression model with the retinal pigment epithelium to Bruch’s membrane distance in the 0–300 μm rim outside of the GA and choriocapillaris flow deficit percentage in the total scan area minus GA.
