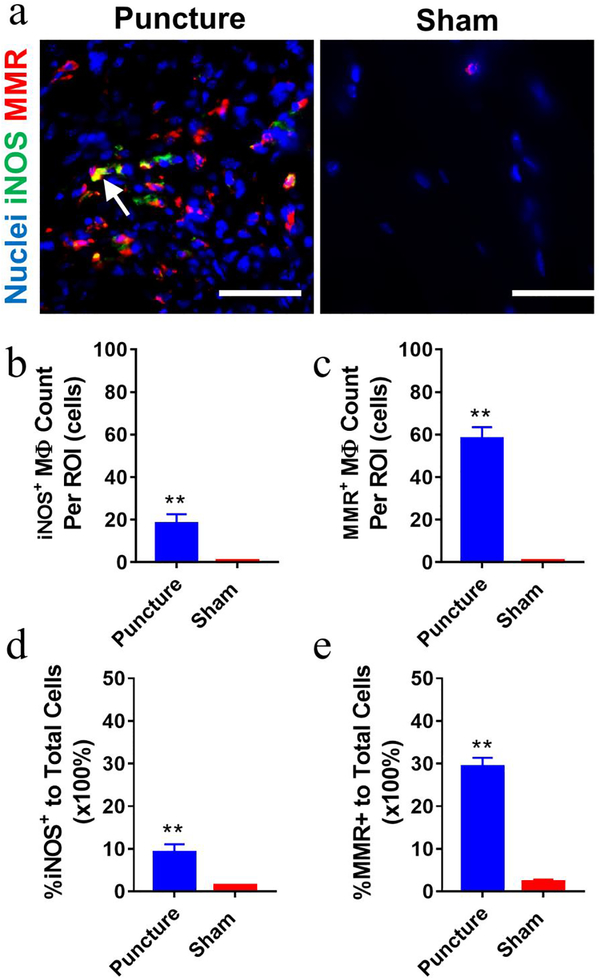
Figure 6. Both M1 and M2-like macrophages were detected in mouse inflammatory infiltration tissues at disc hernia on POD 7.
(a) Representative fluorescence images showed increased iNOS+ and MMR+ macrophages in dissected infiltration tissues of the puncture group compared to the sham. White arrow, iNOS+MMR+. Disc puncture groups showed more iNOS+ (b, d) and MMR+ (c, e) macrophages compared to the sham group. Data are presented as mean ± SEM. Cells were enumerated on 10–15 ROIs per section and 3 sections per sample (n=6 for anterior puncture group and n=4 for sham group). *, p<0.05, student t-test. Scale bar=50 μm.

