
Figure 4.
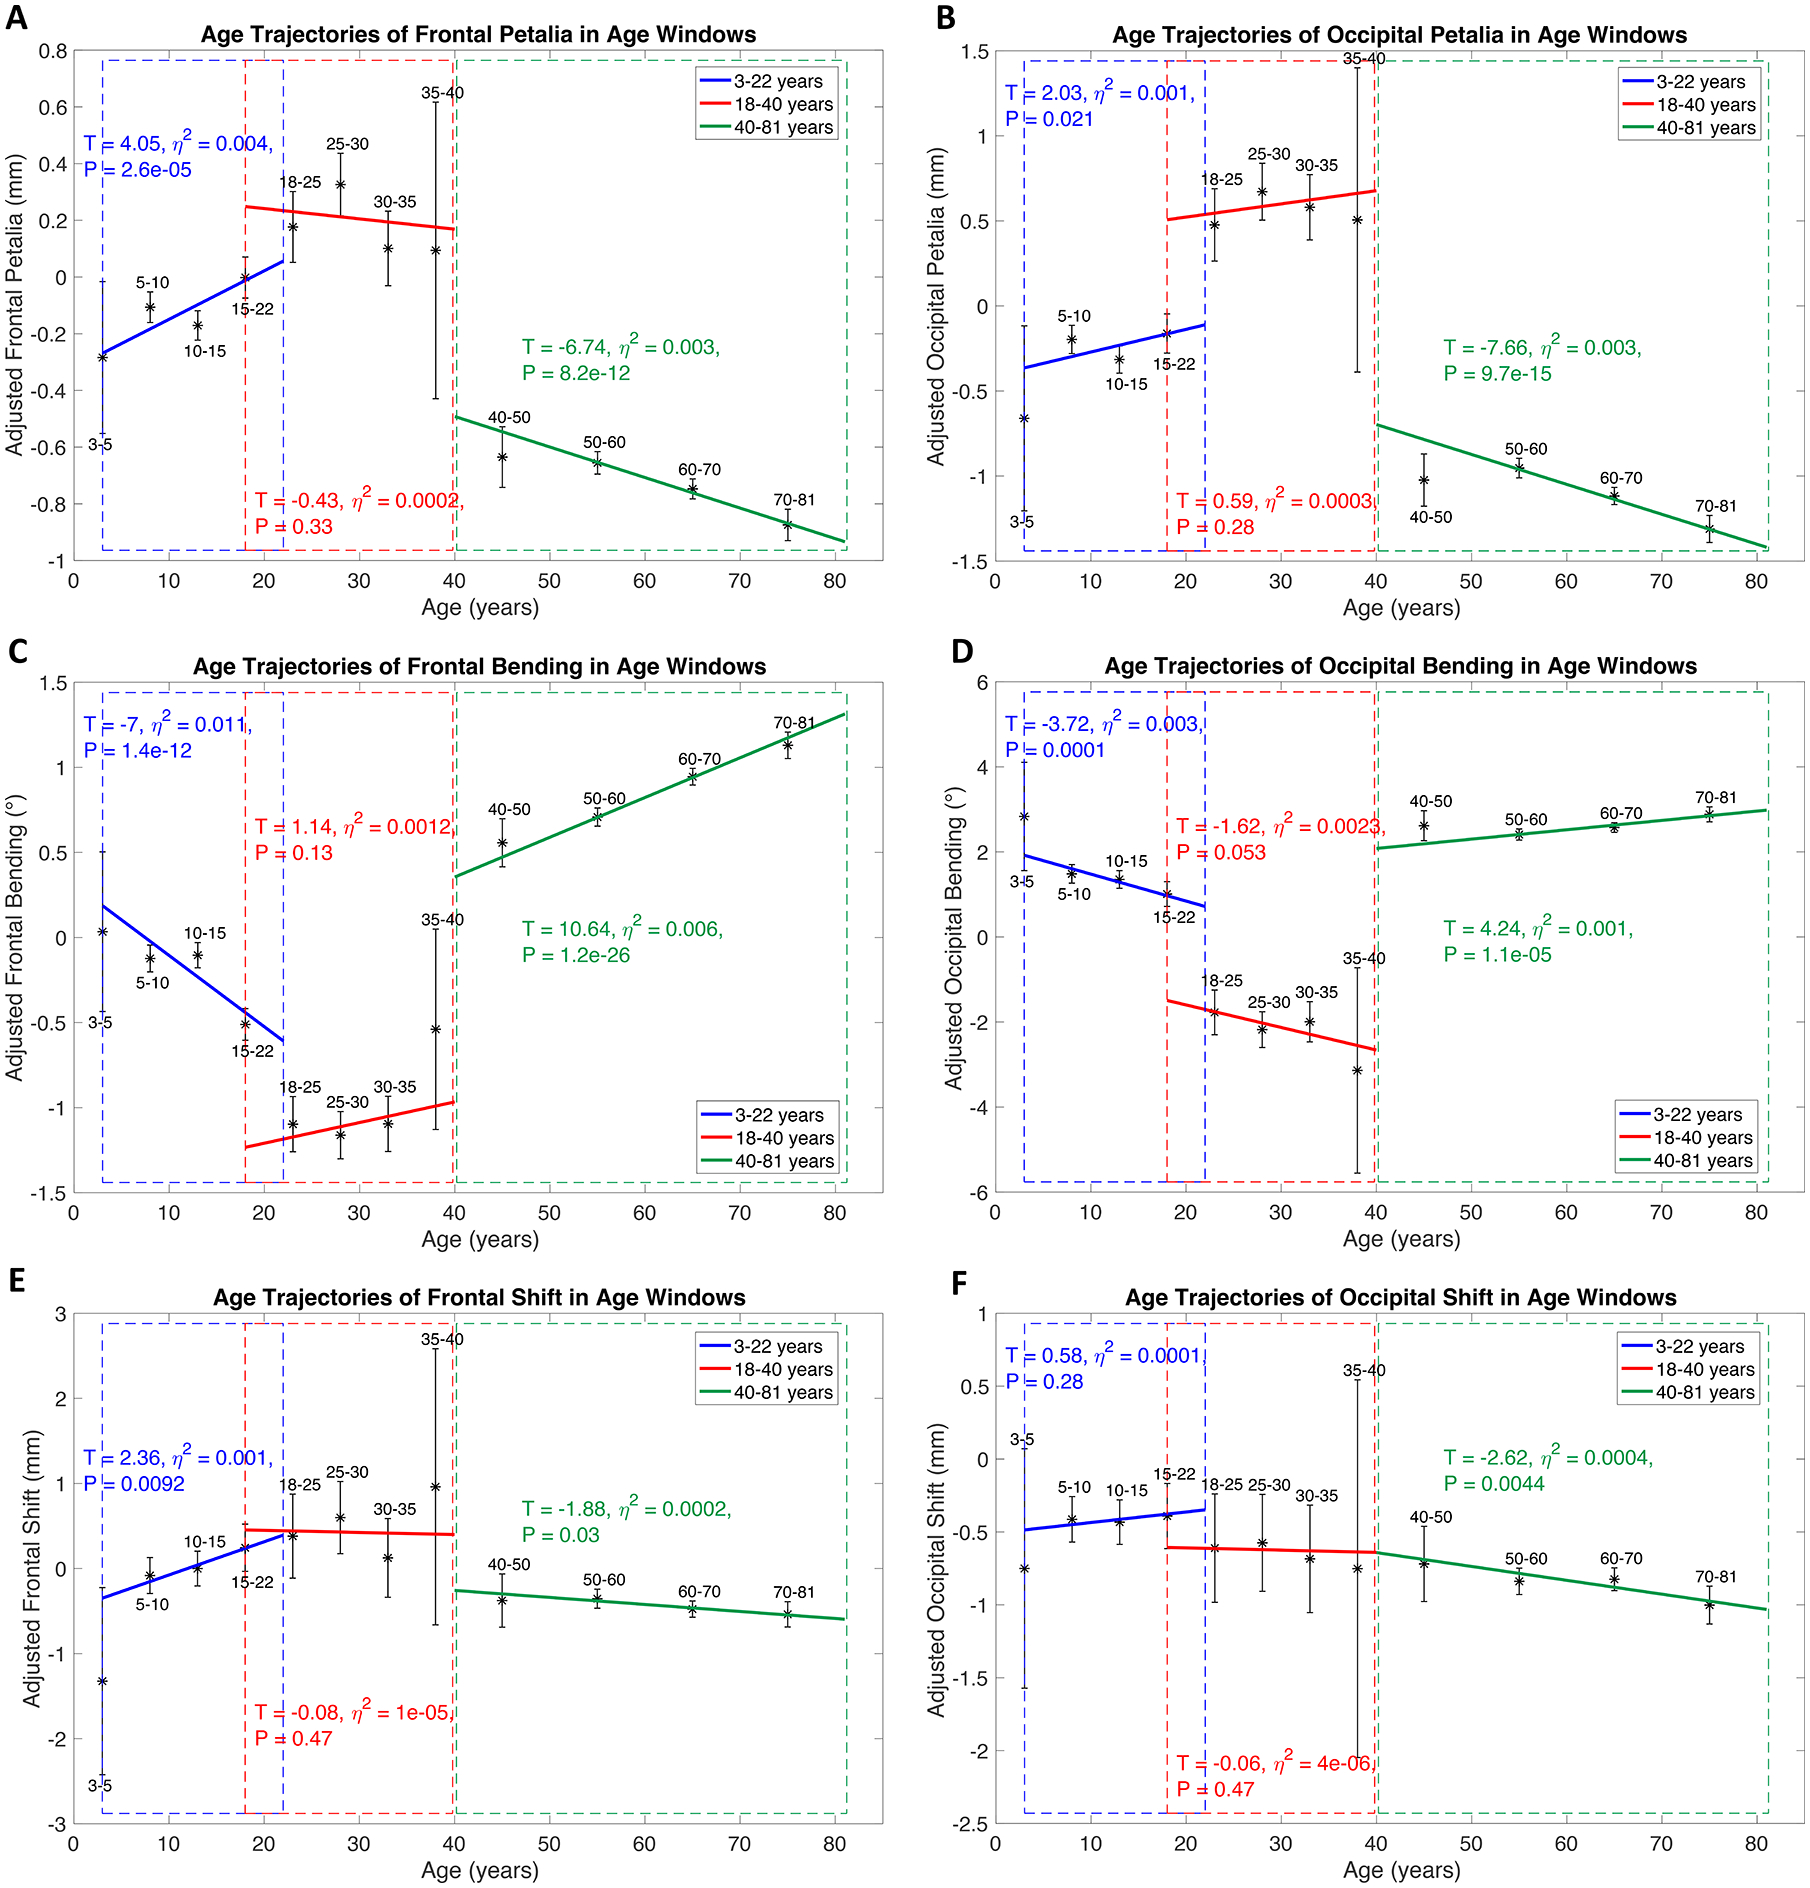
Age effects on petalia, bending and shift assessed in separate age windows using subsamples with overlapped age ranges (ABCD, PING and PNC for 3–22 years, HCP and a part of ICBM for 18–40 years, UKB and a part of ICBM for 40–81 years) and adjusting for sites and scanners and other covariates. Blue, red and green lines represent fitted age trajectories in age windows of 3–22, 18–40 and 40–81 years respectively. Statistics for age effects in each age window are annotated with the same color of the corresponding age trajectory. Blue, red and green dash rectangles highlight the age windows respectively. Black asterisks with error bars show the means and 95% confidence intervals of adjusted measures of frontal/occipital petalia, bending and shift in sub-age groups. Age-related effects on tissue distribution asymmetries and surface positional asymmetries assessed in the split analyses are illustrated in Fig. S7–S8.