
Figure 7.
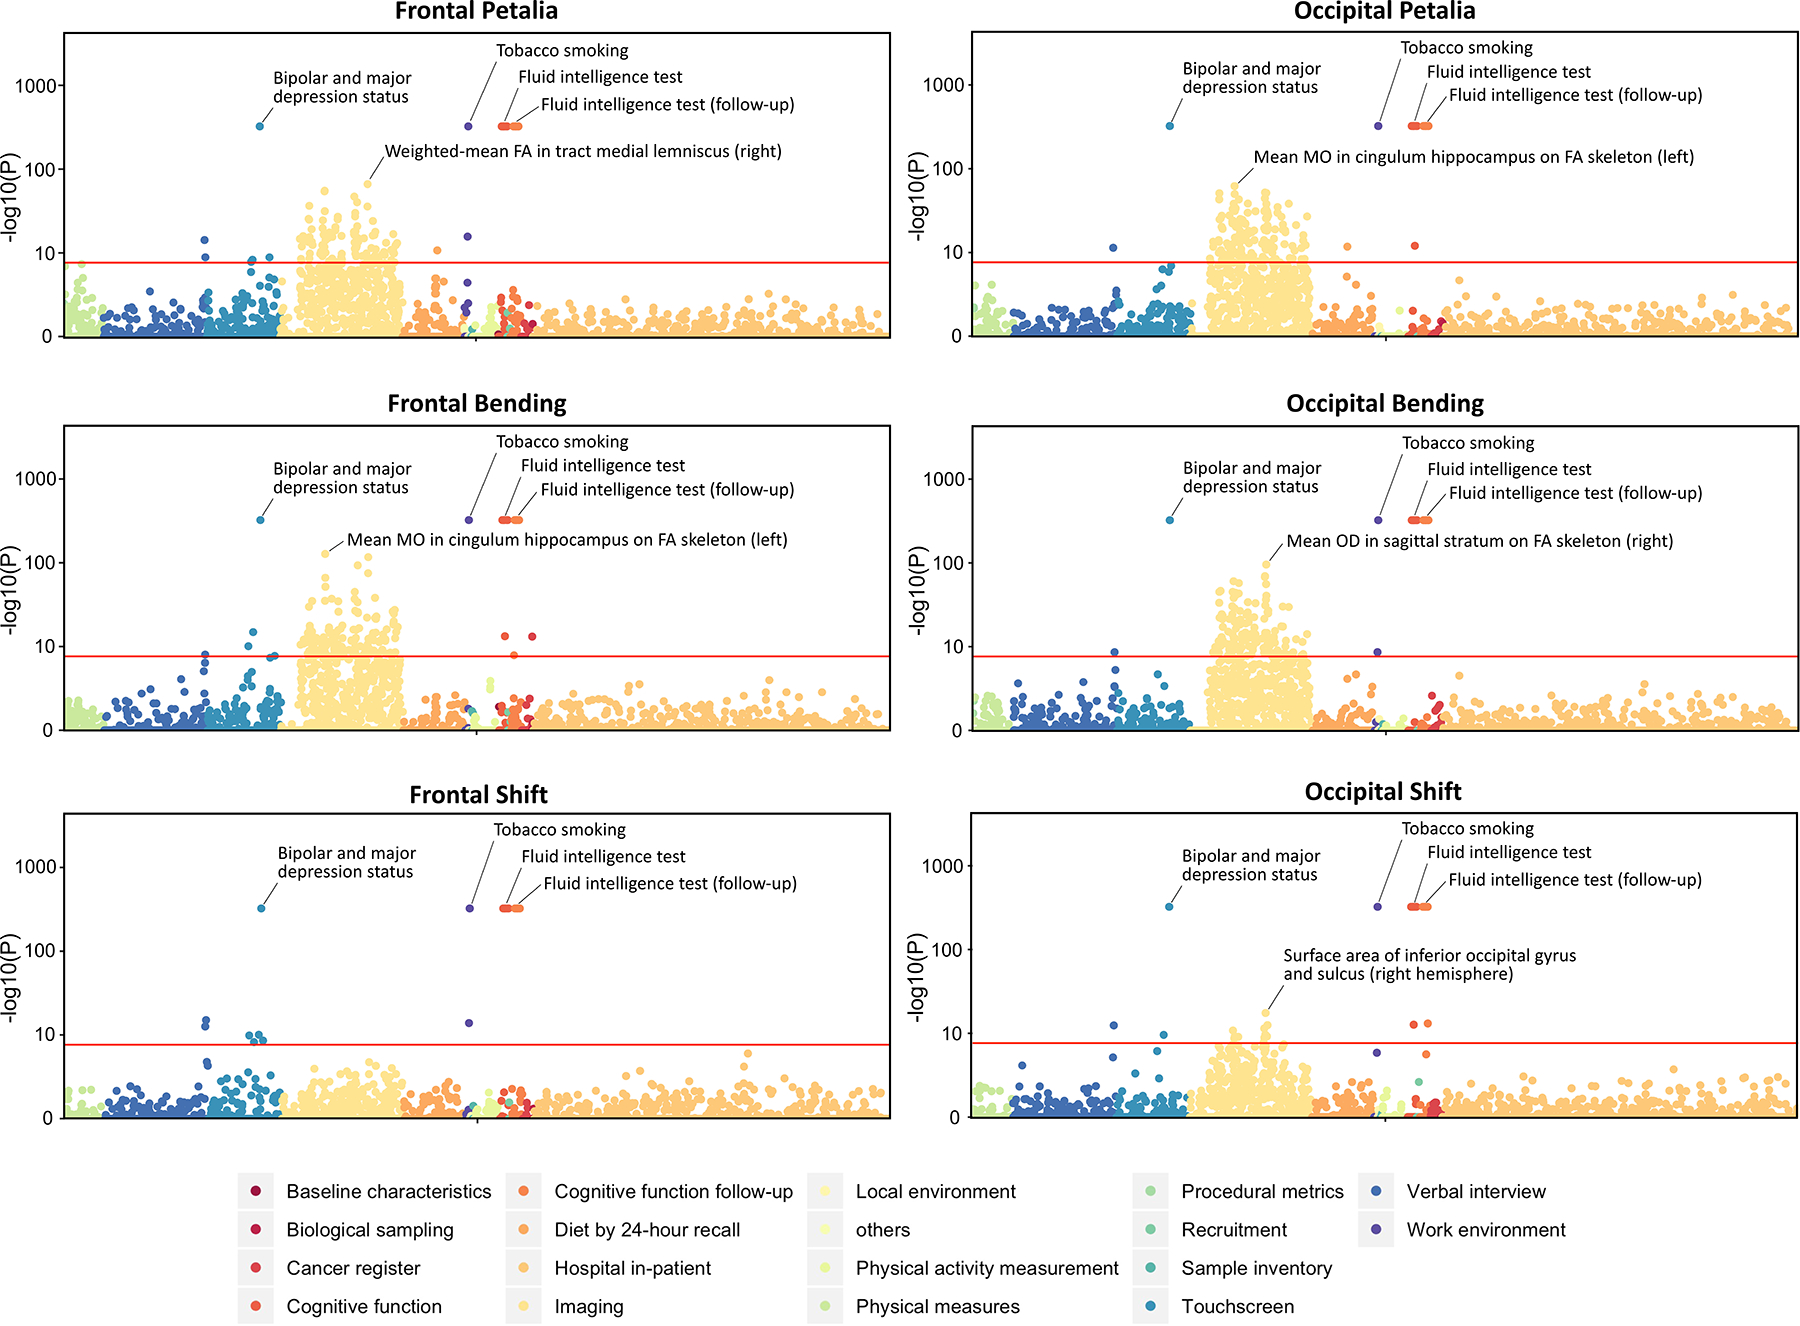
Manhattan plots for phenome-wide associations of frontal/occipital petalia, bending and shift assessed using the UK Biobank dataset. Red lines indicate the phenome-wide significant threshold adjusted for the number of brain torque measures (P < 0.05/6334 phenotypes/348 BT measures = 2.27e-8). For complete results of the phenome scans, see Table S8–S13.