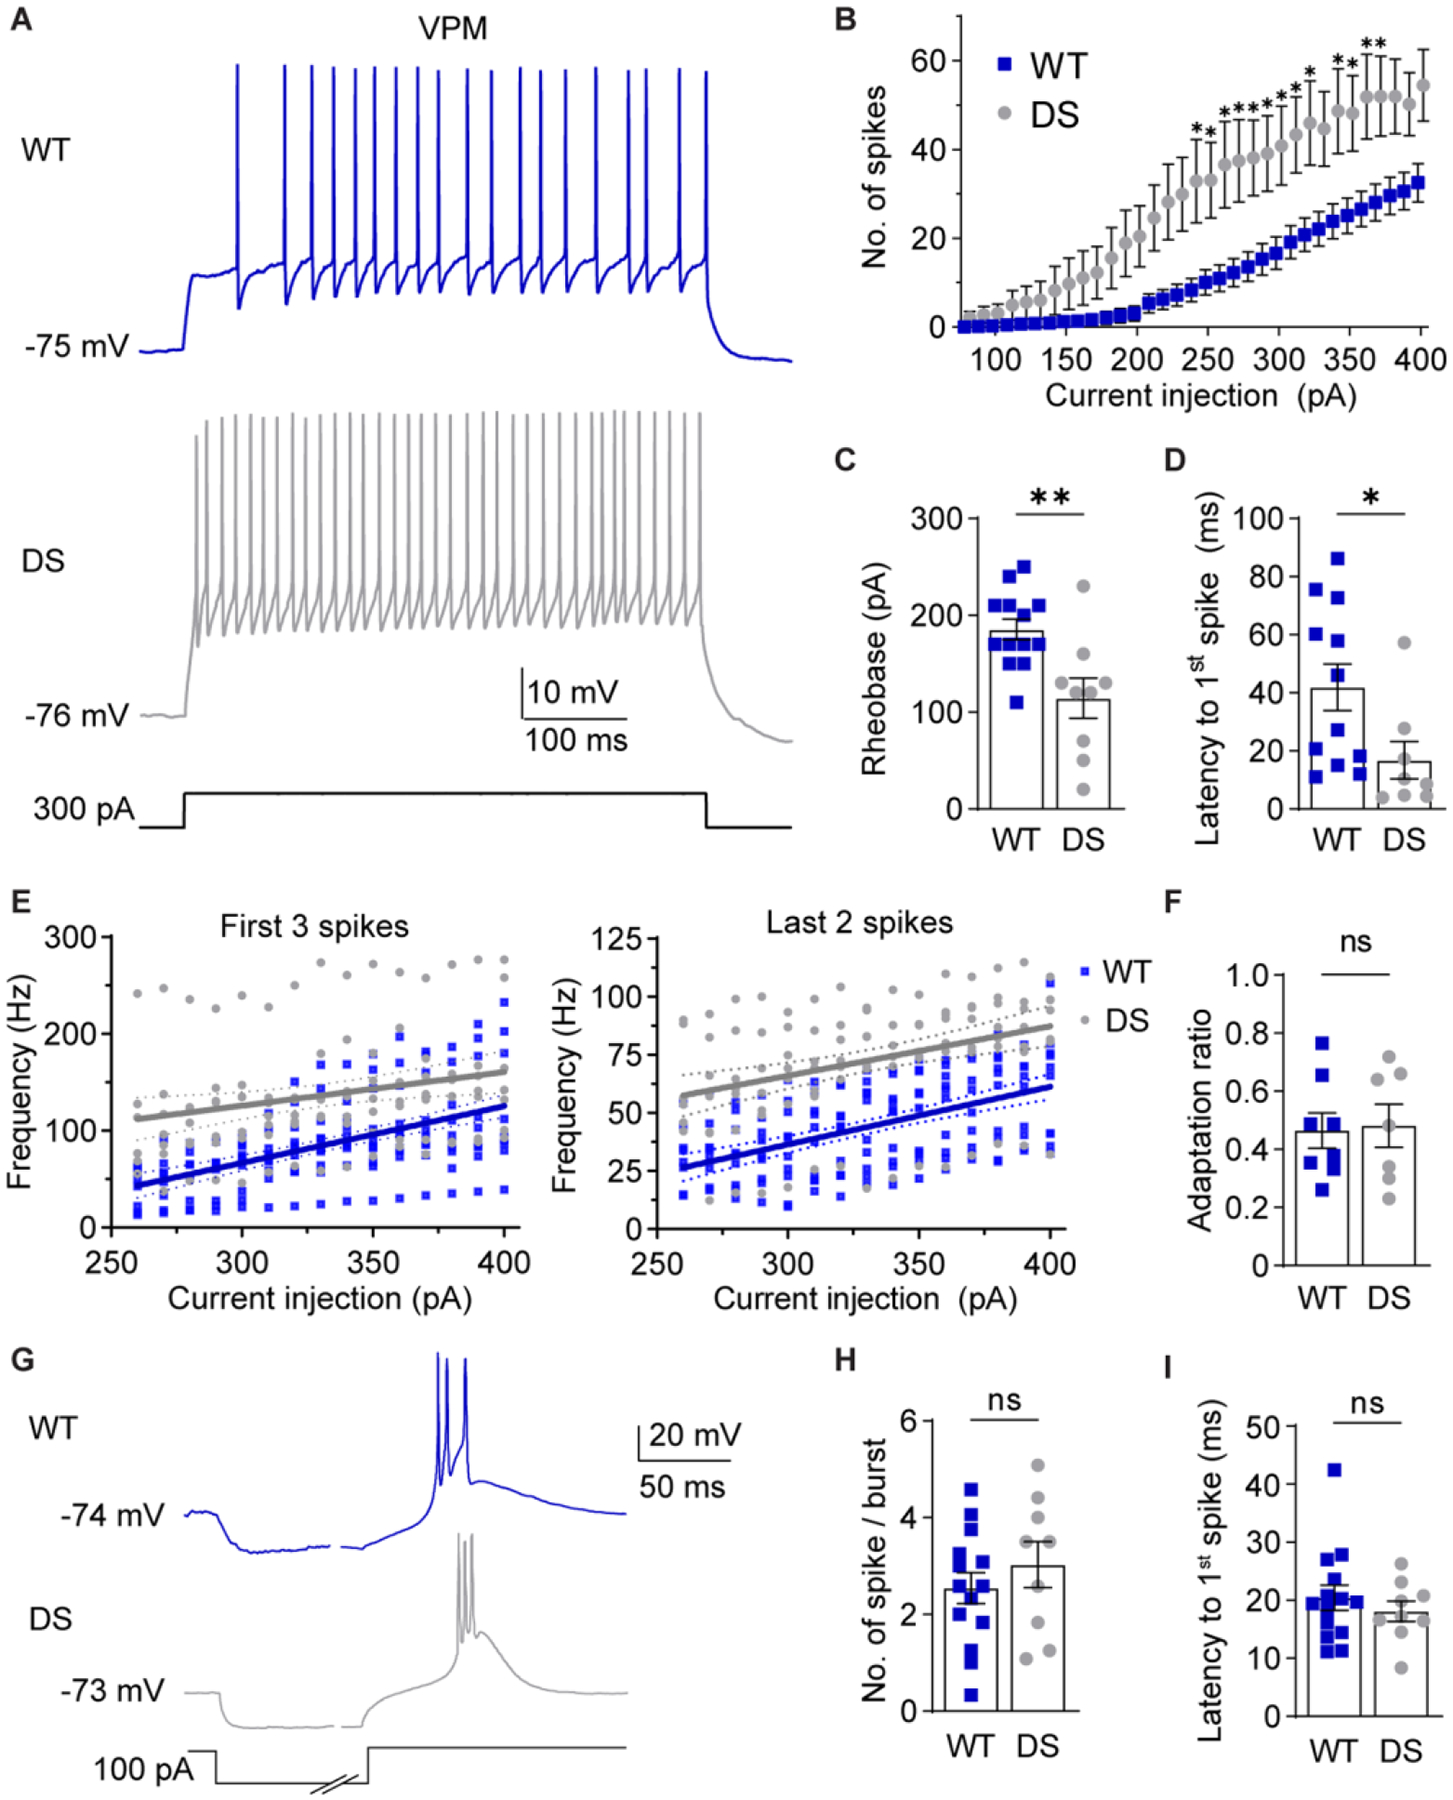
Figure 4. NaV1.1 haploinsufficiency alters VPM neuron excitability.

A. Representative traces show VPM spike firing in response to depolarizing current injections from RMP. B. The number of spikes at each current injection was analyzed by a two-way repeated measures ANOVA (WT: n = 12 cells from 8 mice; DS: n = 9 from 5 mice; Genotype: F(1,19) = 7.992, p = 0.011, Interaction: F(32,608) = 4.677, p < 0.001) with posthoc Sidak’s tests at each current injection (*p < 0.05). C. Rheobase for WT (n = 13 cells from 8 mice) and DS (n = 9 cells from 5 mice) neurons were analyzed by unpaired t-test (**p = 0.004). D. Spike latency for WT (n = 12 cells from 8 mice) and DS (n = 8 cells from 5 mice) neurons were compared by an unpaired t-test (*p = 0.037). E. The frequency of the first 3 spikes and last 2 spikes were plotted for each cell across current injections. Linear regression of WT and DS data yielded the plotted lines with 95% CI bands, and fits were compared by sum of squares F tests. First 3 spikes: F (2,244) = 36.50, p < 0.001. Last 2 spikes: F (2,244) = 59.13, p < 0.001. F. Spike frequency adaptation ratios (last 2 spikes/first 3 spikes) were averaged across all current injections for each cell and compared by an unpaired t-test (p =0.860). G. Representative traces show rebound burst firing upon recovery from hyperpolarization. H. Spikes per burst (p = 0.39) and (I) burst latency (p = 0.46, WT: n = 14 cells from 8 mice, DS: n = 9 cells from 5 mice) were analyzed by unpaired t-tests. The symbols in all bar graphs represent individual neurons.
