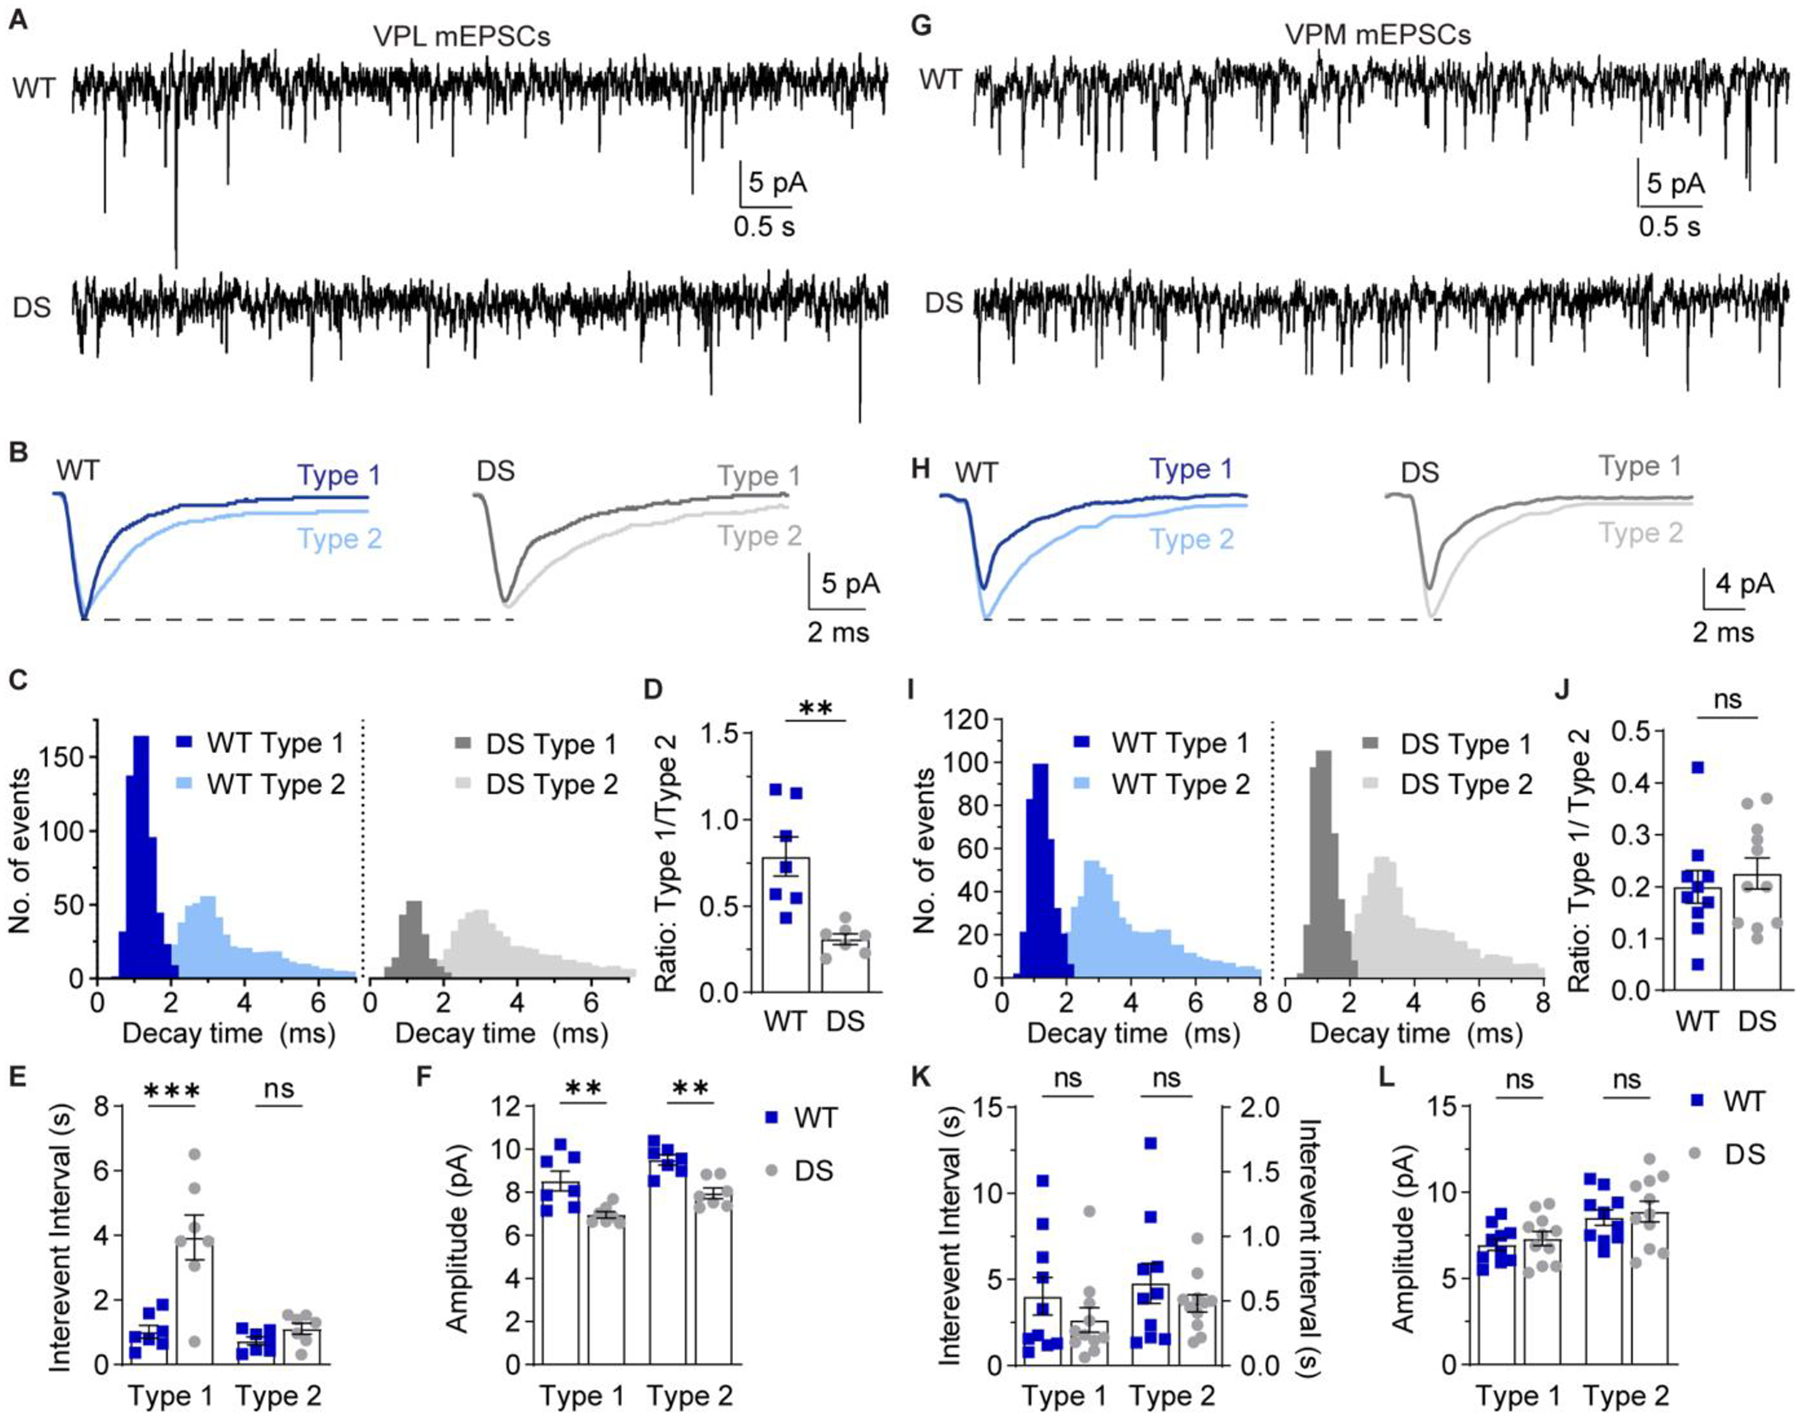
Figure 6. VPL neurons in DS mice exhibit reduced glutamatergic synaptic transmission.

A. mEPSCs were recorded from VPL neurons in acute brain slices in the presence of 1 μM TTX. B. Representative traces show ensemble averages of WT and DS Type 1 and Type 2 VPL mEPSCs as determined by decay times. C. The decay time distributions from each cell were averaged for WT and DS groups to generate histograms of the mean number of events per cell (bin size = 0.2 ms). D. The ratio of Type 1 to Type 2 events was quantified for each WT (n = 7 cells from 6 mice) and DS neuron (n = 7 cells from 7 mice) and analyzed by unpaired t-test (**p = 0.002). E. Inter-event interval and (F) amplitude values for Type 1 and Type 2 mEPSCs in VPL neurons were analyzed by two-way ANOVA with posthoc Sidak’s tests. Inter-event interval: Genotype F(1,24) = 19.28, p < 0.001; Interaction F(1,24) = 11.42, p = 0.002; Type 1 WT vs. DS: ***p < 0.001; Type 2 WT vs. DS: p = 0.73. Amplitude: Genotype F(1, 24) = 27.15, p < 0.001; Interaction F(1,24) = 0.002, p = 0.969. Type 1 WT vs. DS: **p = 0.002; Type 2 WT vs. DS: **p = 0.003. G. mEPSCs were recorded from VPM neurons and (H) representative traces show ensemble averages of WT and DS Type 1 and Type 2 mEPSCs. I. The decay time distributions from each cell were averaged for WT and DS groups to generate histograms of the mean number of events per cell (bin size = 0.2 ms). J. Type 1/Type 2 event ratios for WT (n = 10 cells from 8 mice) and DS (n = 11 cells from 9 mice) VPM neurons were analyzed by unpaired t-test (p = 0.57). K. Inter-event interval and (L) amplitude values for Type 1 and Type 2 mEPSCs in VPM neurons were analyzed by two-way ANOVA with posthoc Sidak’s tests. Inter-event interval: Genotype F(1,38) = 1.407, p = 0.243; Interaction F(1,38) = 0.893, p = 0.351; Type 1 WT vs. DS: p = 0.261; Type 2 WT vs. DS: p = 0.982. Amplitude: Genotype F(1, 38) = 0.573, p = 0.454; Interaction F(1,38) < 0.001, p = 0.993. Type 1 WT vs. DS: p = 0.840; Type 2 WT vs. DS: p = 0.833. See Supplementary Figure S5 for cumulative distribution inter-event interval and amplitude
