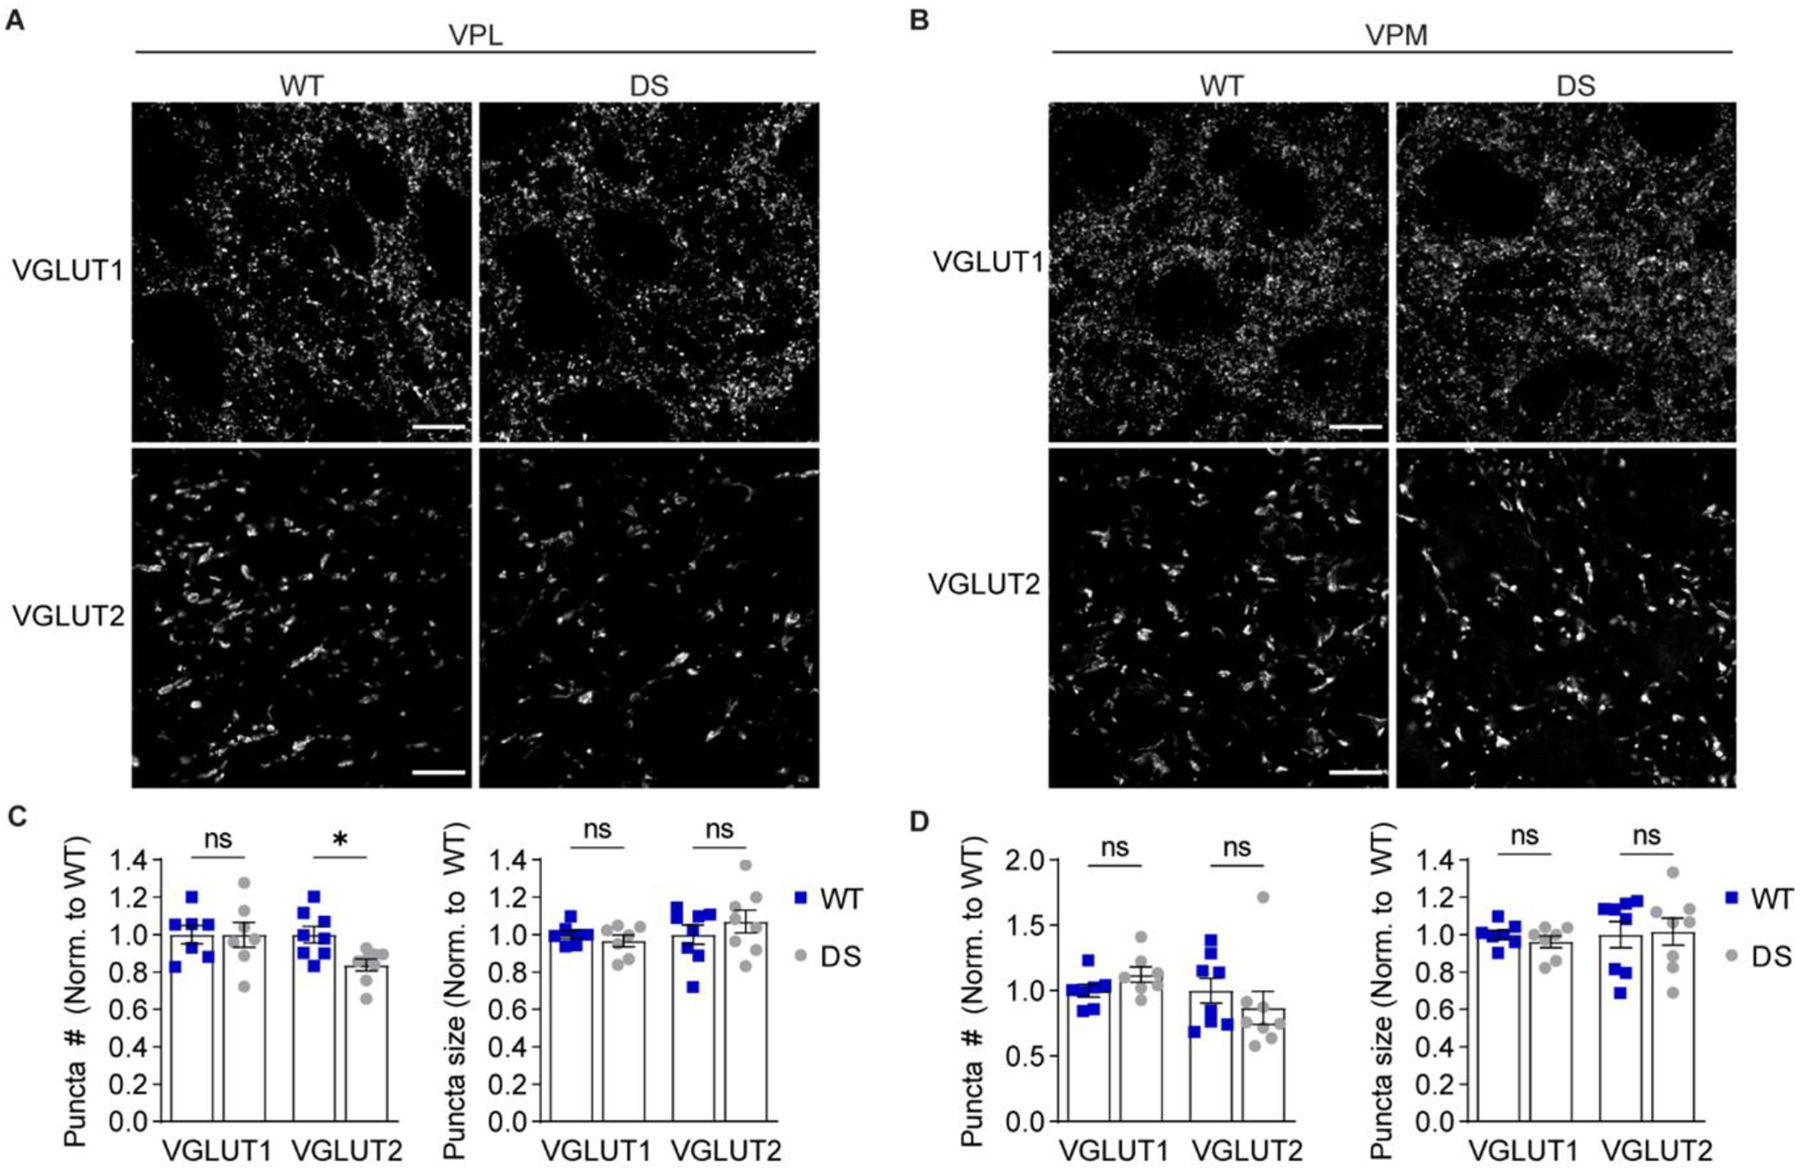
Figure 7. DS mice exhibit reduced ascending sensory input to the VPL.

Representative 100X images show VGLUT1 (scale bar: 10 μm) and VGLUT2 (scale bar: 20 μm) immunostaining in the (A) VPL and (B) VPM. The number and size of VGLUT1 and VGLUT2 puncta were quantified for the (C) VPL and (D) VPM (n = 7) and analyzed by two-way ANOVA. VPL puncta number: Genotype F(1,26) = 2.914, p = 0.10; Interaction F(1,26) = 2.829, p = 0.10; posthoc Sidak’s tests: VGLUT1, p = 0.99; VGLUT2, *p = 0.04. VPL puncta size: Genotype: F(1,26) = 0.161, p = 0.69; Interaction: F(1,26) = 1.262, p = 0.27; posthoc Sidak’s tests: VGLUT1, p = 0.86; VGLUT2, p = 0.47. VPM puncta number: Genotype: F(1,26) = 0.002, p = 0.96; Interaction: F(1,26) = 1.9, p = 0.18; posthoc Sidak’s tests: VGLUT1, p = 0.60; VGLUT2, p = 0.52. VPM puncta size: Genotype: F(1,26) = 0.040, p = 0.84; Interaction: F(1,26) = 0.221, p = 0.64; posthoc Sidak’s tests: VGLUT1, p = 0.88; VGLUT2, p = 0.98. Data points in all bar graphs represent individual mice.
