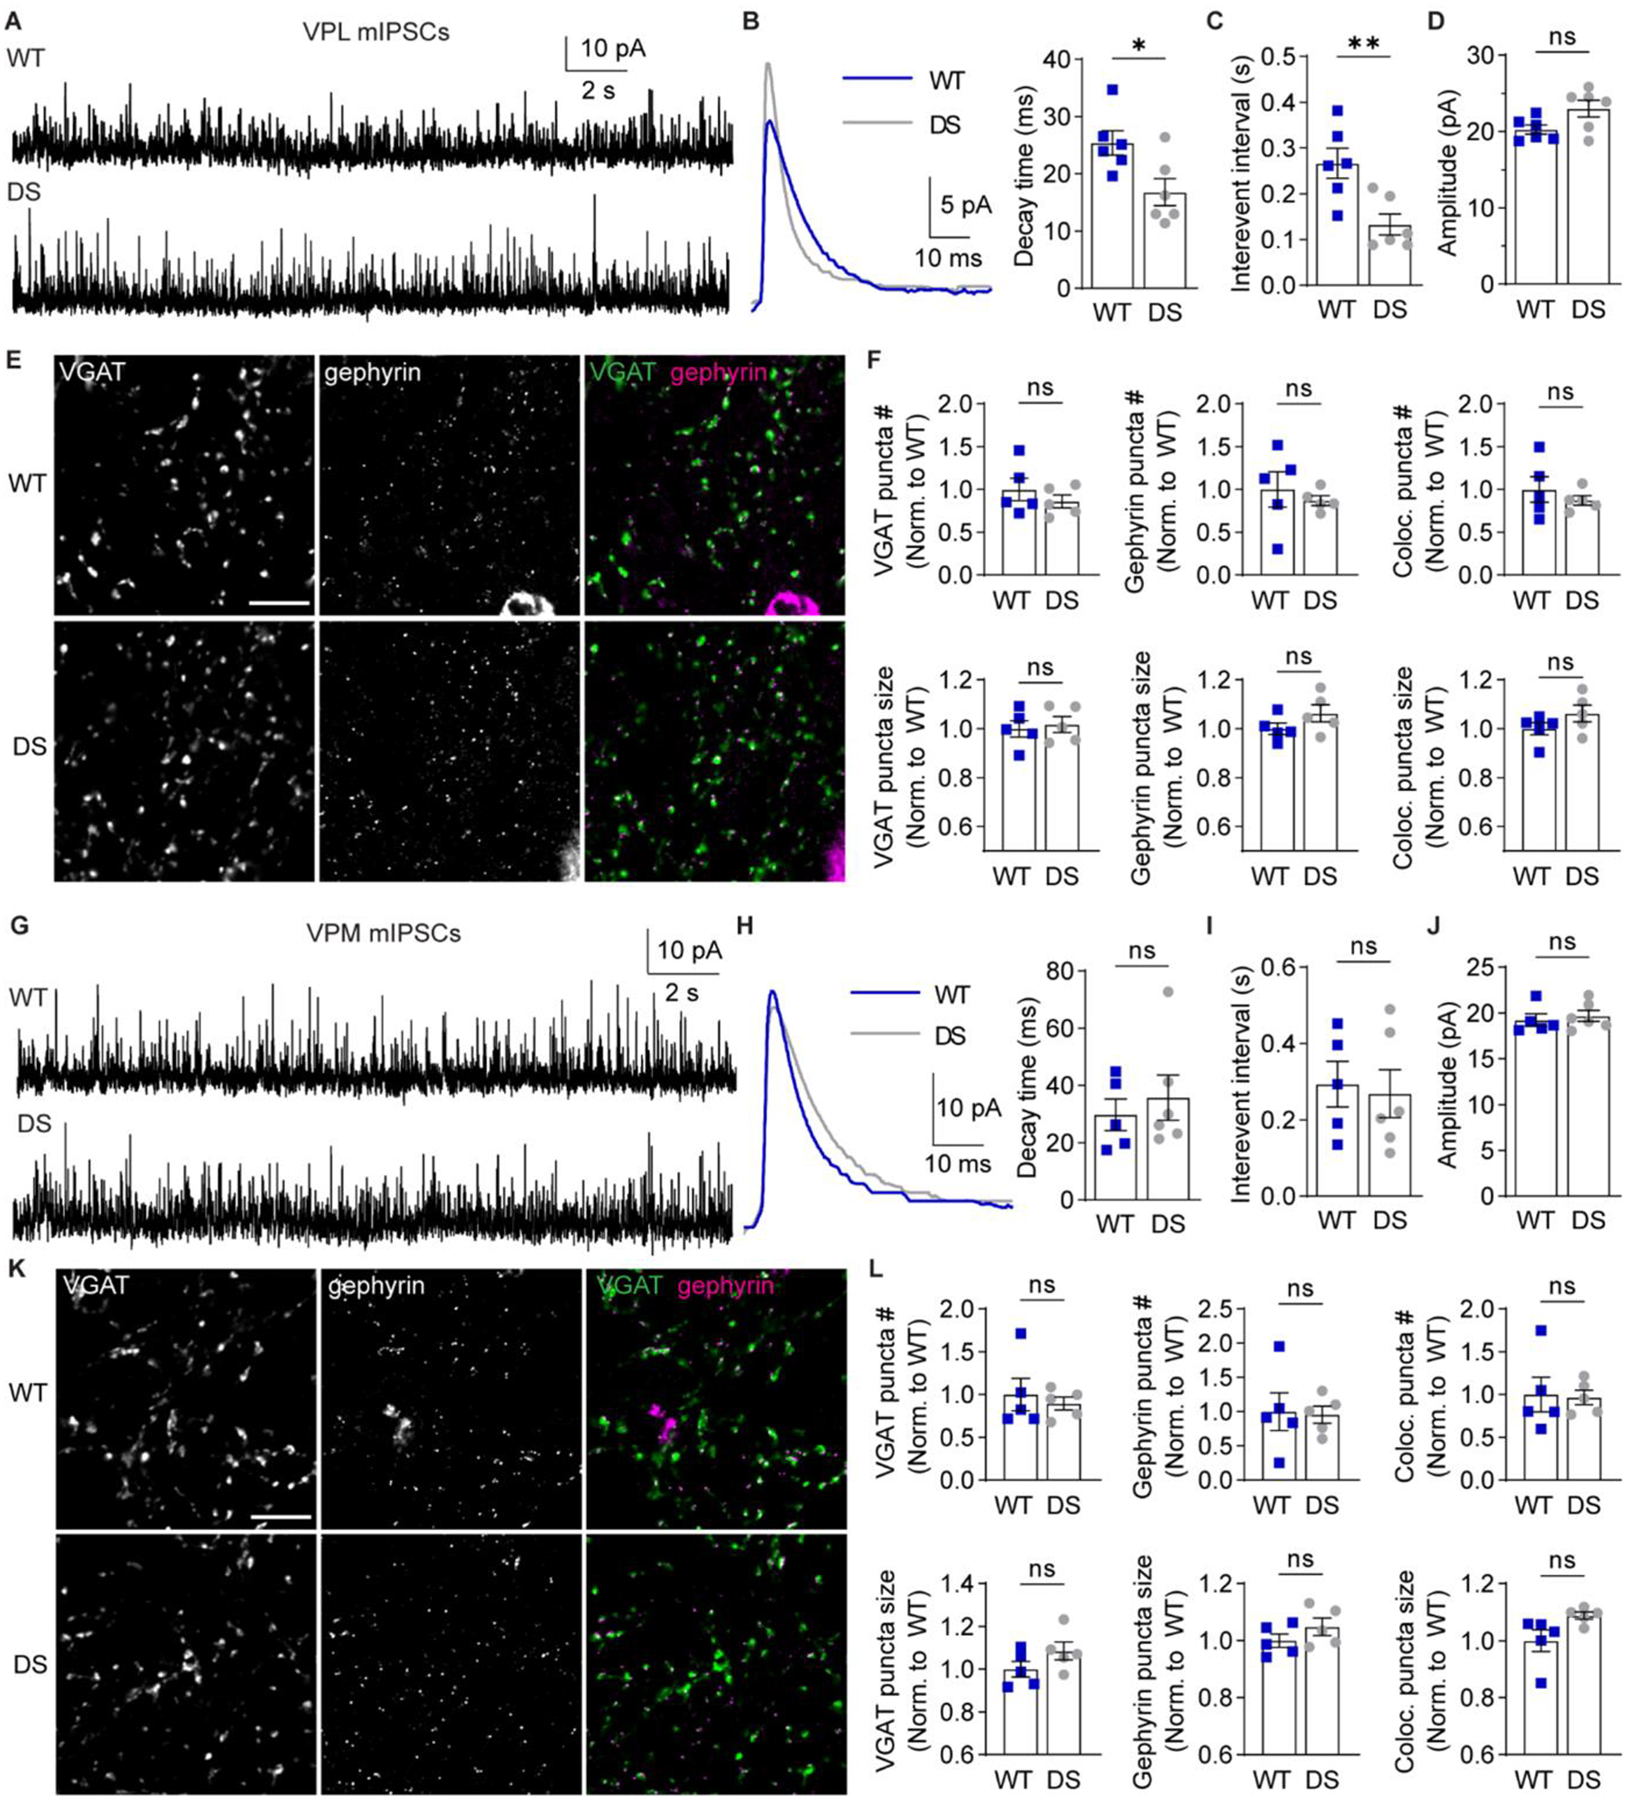
Figure 8. VPL neurons in DS mice exhibit reduced GABAergic synaptic transmission.

A. mIPSCs were recorded from VPL neurons in acute brain slices in the presence of 1 μM TTX. B. Representative traces show ensemble averages of WT and DS mIPSCs. mIPSC ensemble averages were fitted to determine decay time for WT and DS neurons (n = 6 cells from 5 mice) and compared by unpaired t-test (*p = 0.02). WT and DS mIPSC (C) inter-event interval (**p = 0.008) and (D) amplitude (p = 0.054) were quantified for each neuron and compared by unpaired t-tests. E. Representative 100X images show VGAT and gephyrin immunolabeling in the VPL (scale bar: 10 μm). F. The number and size of VGAT, gephyrin, and VGAT-gephryin colocalized puncta in the VPL (n = 5 mice) were compared by unpaired t-tests. VGAT puncta number: p = 0.39, size: p = 0.72; gephyrin puncta number: p = 0.56, size p = 0.17; colocalized puncta number: p = 0.44, size: p = 0.18. G. mIPSCs were recorded from VPM neurons, and (H) representative traces show ensemble averages of WT and DS mIPSCs. mIPSC ensemble averages were fitted to determine decay time for WT (n = 5 cells from 5 mice) and DS (n = 6 cells from 6 mice) neurons and compared by an unpaired t-test (p = 0.57). I. WT and DS inter-event interval (p = 0.785) and (J) amplitude (p = 0.635) were compared by unpaired t-tests. K. Representative 100X images show VGAT (scale bar: 10 μm) and gephyrin immunolabeling in the VPM. L. The number and size of VGAT, gephyrin, and VGAT-gephryin colocalized puncta were quantified in the VPM (n = 5 mice) and compared by unpaired t-tests. VGAT puncta number: p = 0.62, size: p = 0.16; gephyrin puncta number: p = 0.89, size p = 0.24; colocalized puncta number: p = 0.88, size: p = 0.06. The data points in the bar graphs represent individual neurons (B-D, H-J) or mice (F, L).
