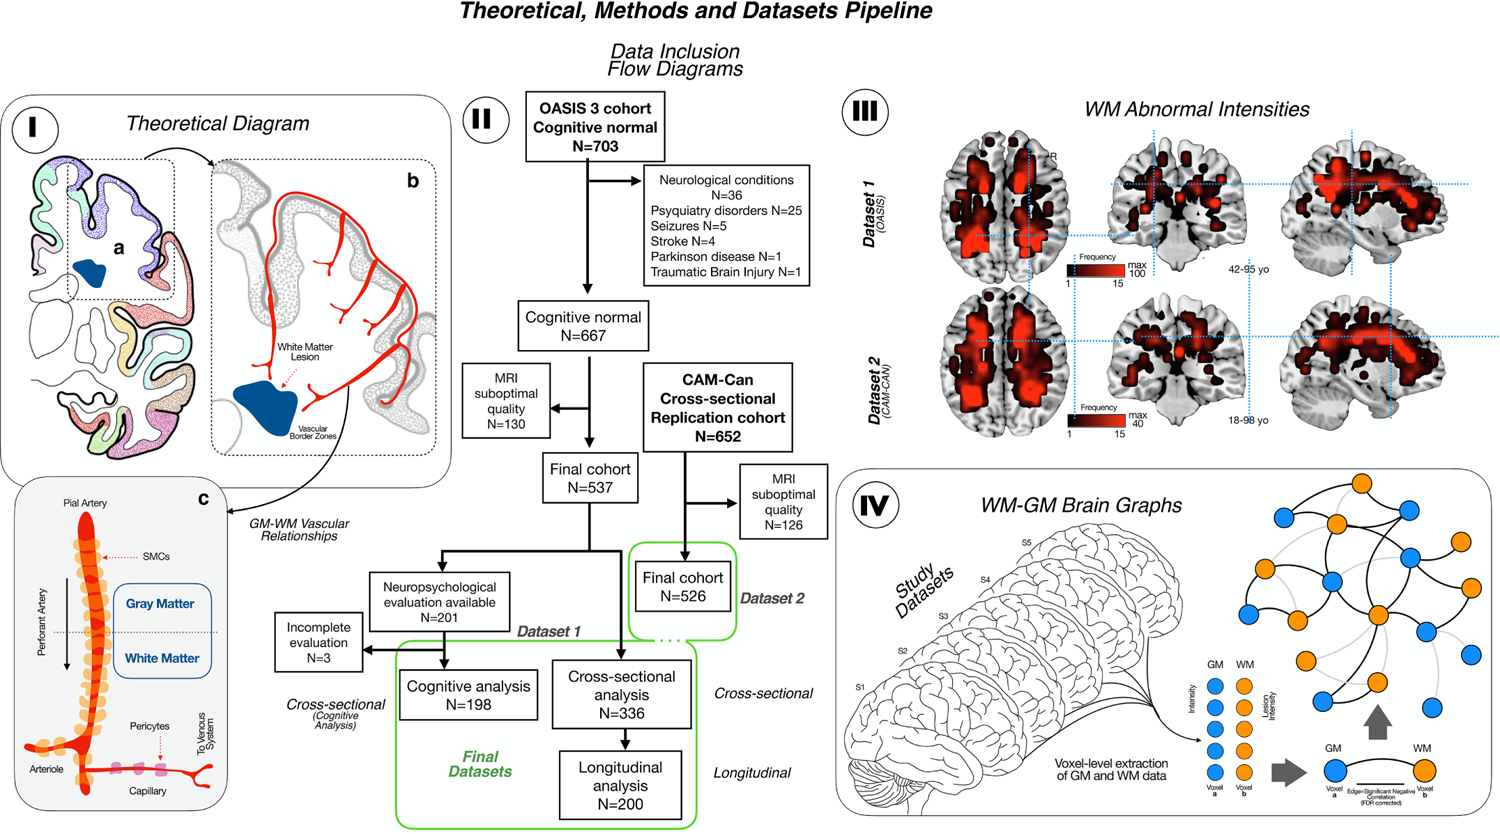
Figure 1.

I. The theoretical diagram shows the hypothesis for the SVD damage, with primary affectation of the cerebral blood flow regulation in perforant arteries from cortex to white matter in the vascular border zones. II. Flow chart of the participants included in both datasets. III. Detection of WM lesions in the T1 MRI sequences of both cohorts following by the creation of a WM lesion frequency map (the brightest the color, the higher the frequency of the lesions with a maximum of 100 for Dataset 1 and 40 for Dataset 2). For each Dataset, the age range is described. IV. WM-GM brain graph. First, GM and WM data were voxel-level extracted, being each voxel a node of the graph. Then, we create a Pearson correlation matrix between each GM and WM node and each significant negative correlation (after FDR correction) between GM and WM in understand as an edge, so we can construct a GM-WM connectivity graph.
